Comment, July 27, Jos Algra
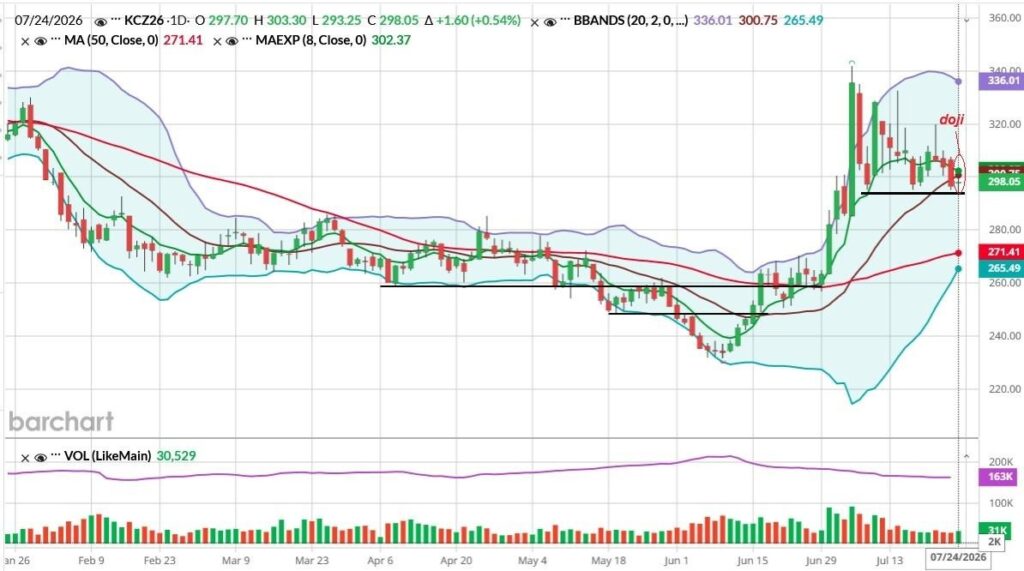
The price of coffee in New York experienced unprecedented movements over the past three weeks. There was no Elliott Wave forming, as was analysed as a possibility in the blog post three weeks ago (Panic triggers unexpected rally). On the contrary, the price continued to rise spectacularly, reaching 341.80 cents.
From there, the funds ran out of steam, the price movement became volatile, and then settled sideways around 300 cents. Last Friday, the close was just below at 298.05.
We are using the second December position because September is at a steep premium of 13 to 20 cents and is even more volatile. The First Notice Day is August 22nd.
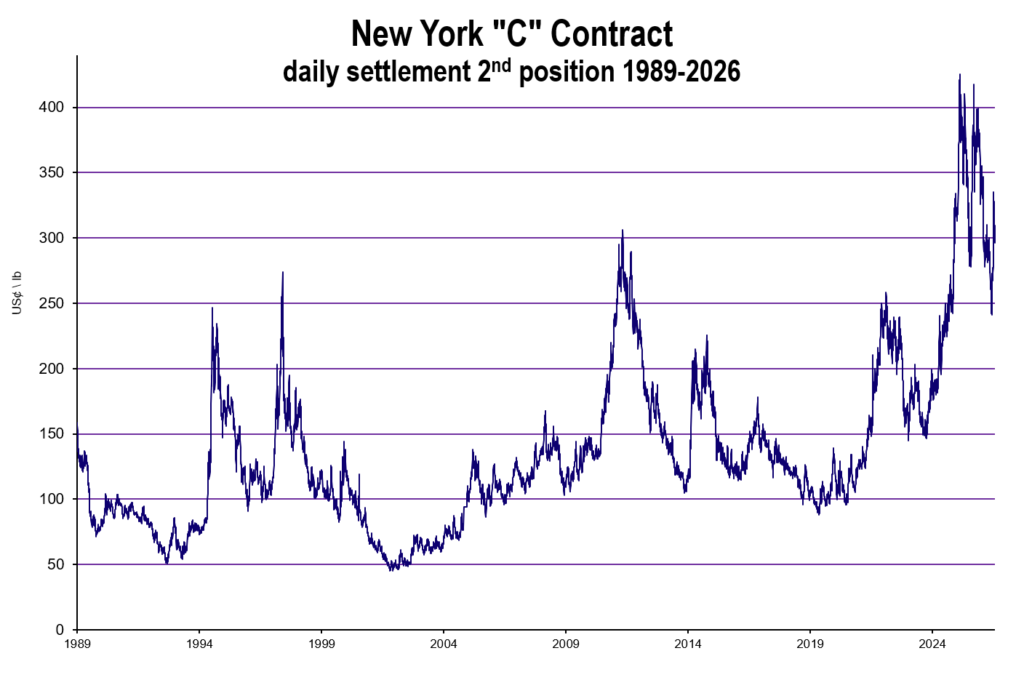
After months of decline, the price in New York began to rise in mid-June. The price increase accelerated after June 30th. Causing some panic on the stock market, the price exploded on July 6, reaching its highest level in five and a half months.
The main cause, as is often the case, is the weather in Brazil. Excessive rainfall is delaying the harvest in Brazil and other countries, such as Peru. Brazilian producers are holding onto coffee because they don’t know how much they will have and what its quality will be. There is also concern about the potential impact of El Niño on the next harvest. On Wednesday and Thursday, the price fell, partly due to the USDA FAS report forecasting a large surplus in the new harvest.
Other contributing factors include geopolitical instability, the energy crisis caused by the war in the Middle East, the exchange rate between the dollar and the Brazilian real and other currencies, low inventories, constant changes in Trump’s policies and the announcement of new tariffs, etc. Following the blockade of the Strait of Hormuz by the United States and Iran, the Houthis have now also blocked the Bab al-Mandab Strait between Yemen and Djibouti, which provides access to the Red Sea and the Suez Canal.
Everything impacts financial markets and the global economy, increasing the prices of almost all products and services, and causing significant volatility in commodity prices.
But there is another important factor: margin calls on the stock exchange. During the week of July 6, when the price of coffee exploded, margins were increased twice, forcing many to abandon their positions due to a lack of liquidity, especially traders, with producers and roasters following suit. This gave speculators, who have deeper pockets, free rein to manipulate the price as they saw fit.
The price in the futures market became even more decoupled from the price in the physical market. This greatly accelerated the price increase and significantly heightened volatility. On July 6, the Bollinger Band widened by 94.35 cents, from 214.55 to 308.90.
The market movements were spectacular, violent, and unprecedented, and new records were set. From the low on June 9th to the high on July 6th, the price rose 110 cents, from a low of 231.80 to a high of 341.80, the highest price since early January.
On July 6th, the price rose 49.10 cents at the close (second highest in December), from 286.30 to 335.40. The previous record for one-day change was 47.00 cents. On the same day, the difference between the high and low price was 56.55 cents (341.80-285.25). The previous record was 35.05 cents.
Where the price will move is difficult to predict, as is almost always the case. On Friday, a doji formed (see the daily price chart below), because the opening and closing prices were almost identical; the market is undecided whether to continue sideways, fall further, or rise again.
The daily chart is about to give a sell signal (the 4-hour chart already gave one on Wednesday, July 22nd), as can be seen in the chart, because the 8-day exponential moving average is about to fall below the 20-day simple moving average. On the other hand, the price remains well above the 50-day moving average.
Support: 293.25, 285.25, 256.90, 250.55, and 231.80. Resistance: 300.75 (pivot), 319.95, and 341.80.
The Commitment of Traders report shows that combined open interest in futures and options fell by 14,282 contracts over the past three weeks, from 234,963 to 220,681. Open interest in futures alone decreased from 180,244 to 163,222 last Thursday. The peak was reached in the first half of June at 215,469, providing the momentum for the impressive rally. Daily volume reached as high as 91,000 contracts when the price was at its peak, then dropped to around 30,000.
Net fund positions have moved back out of negative territory, rising to 10,583 net longs. Spreads, which reflect the degree to which each non-commercial trader holds combined long and short positions, initially rose to 106,349, but then fell to 90,569. This shows that many funds are not currently taking positions.
The long position of commercial traders fell by 5,749 lots to 52,582. Roasters are hesitant to lock in contracts at these price levels. Furthermore, we are entering the summer season in the main consuming countries, when consumption traditionally declines.
The short position of commercial traders rose by 3,539 lots to 99,328. Last week, when prices were higher, it stood at 102,586. Producers took advantage of the price rally to lock in contracts.
Index funds returned to the fray, adding 5,181 contracts for a net long position of 34,432. Almost all of it are longs.
The Trump administration’s special import tariffs have expired; many were struck down by the Supreme Court for lacking legal basis. Trump announced new tariffs of 10% or 12.5% for 60 countries, among others, arguing that they are not doing enough to eliminate forced labour. We’ll see if the court accepts this argument.
Green coffee is exempt, as is instant coffee from Brazil. Brazil faces a 25% tariff for political reasons (the US opposes Lula and supports Bolsonaro), and there are fears that Nicaragua will also face a higher tariff due to the Ortega government’s announcement that elections will no longer be held.
The European Commission has precisely added several products, including instant coffee, to the list of those that must comply with EUDR (anti-deforestation) rules by December 30, 2027. The European Parliament can still oppose these measures.
While Brazil has seen its exports of natural Arabica coffee decline, Ethiopia has partially filled the gap, increasing its export volume. China has overtaken the United States as the third-largest destination, behind Saudi Arabia and Germany. Exports to China grew by 30% last year, thanks to a strong promotional campaign in response to the tariff disputes in the United States.
Consumption in China is growing significantly, especially among young people, which will have a greater impact in the future. China is making substantial investments in Ethiopia and, together with Uganda, is investing in increasing production, as we have previously reported (“Analysing the price drop” and “The price recovers, the economy deteriorates and ICO’s vision”).
Peru is experiencing significant tensions in its domestic coffee market. The harvest has been delayed, and there is increasing competition for the limited parchment coffee available, driving up domestic prices. In the San Martín region of Amazonas, the harvest is 70% complete, but in the rest of the country, it is only 35-45% complete. Production was expected to fall by 10-20% this harvest, but now it is being analysed that it could drop by as much as 40%.
The high domestic prices are not yet significantly reflected in export differentials. Since almost all coffee is processed on the farm and stored as dry parchment, producers can hold onto their coffee, waiting for a better price. There are fears of an increase in defaults from September onward.
On July 22 FAS USDA published its annual report on global coffee supply and demand. In blog posts from May and June, we presented data from the country-specific reports and a provisional global supply and demand balance (see “The FAS USDA forecast and bad news for the price” and “Analysing the price drop”). If you want to create your own pivot tables, the database dating back to 1960 is available here: https://apps.fas.usda.gov/psdonline/app/index.html#/app/downloads.
It contains an analysis of the situation in Brazil, summarizes changes in volumes for Vietnam, Central America and Mexico, Colombia, Ethiopia, Indonesia, and globally. If you are not fluent in English, you will need a translator.
With the complete data, the supply and demand table would look like this (in thousands of bags):

Supply will increase by 10.8 million bags (5.7%) to 189.7 million. Demand will increase by 6.3 million bags (3.5%) to 179.7 million. This will result in a surplus of 9.9 million bags, almost double that of previous years.
We have commented in the past that the USDA FAS (Family Agricultural Standards) usually shows a surplus, the only exceptions being the 2021/22 and 2022/23 cycles. This would be unlikely in recent years, given the market shortage and the very high prices since September 2024 (above $250).
It is possible that coffee was stored to drive up the price, but in the last three cycles, this would represent an additional accumulation of more than 15 million extra bags in storage, while low inventories are reported (24.4 million bags in the last cycle). Other sources have reported significant deficits since 2022 and point to them as the main cause of the high prices.
The USDA FAS data is very comprehensive, useful, and accessible, free of charge. The database is particularly well-suited for various types of analysis. However, systematic bias in the data diminishes its value. We compared the USDA FAS data with that of the ICO (less accessible, less user-friendly, and now almost entirely chargeable), which exhibits a similar but reverse bias: the ICO most often reports a deficit. Averaging the two sources is a simple way to get closer to the truth.
FAS USDA has programmed the release of their annual report on global coffee supply and demand for July 22, which normally is released in June.
Jos Algra is an international consultant with more than 40 years of experience in coffee and working with producer organisations.
This blog was originally published in Spanish in Claase: