Comentario, 27 de julio, Jos Algra
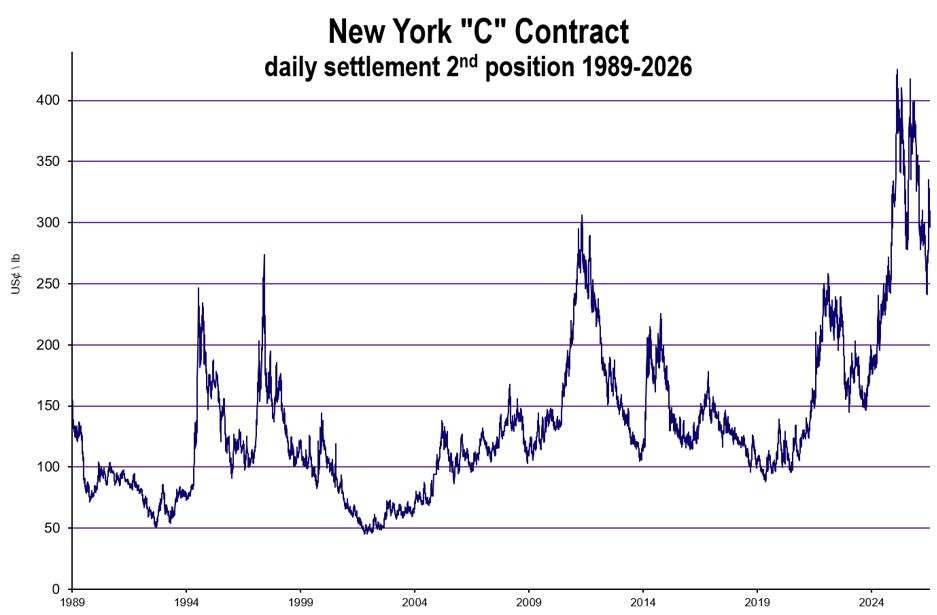
El precio de café en Nueva York tuvo unos movimientos nunca antes vistos en las últimas 3 semanas. Nada de Elliot Wave en formación como se analizó como una o
posibilidad en el blog de hace 3 semanas (Pánico dispara rally inesperado). Todo lo contrario, el precio siguió subiendo de manera espectacular hasta tocar los 341.80 centavos.
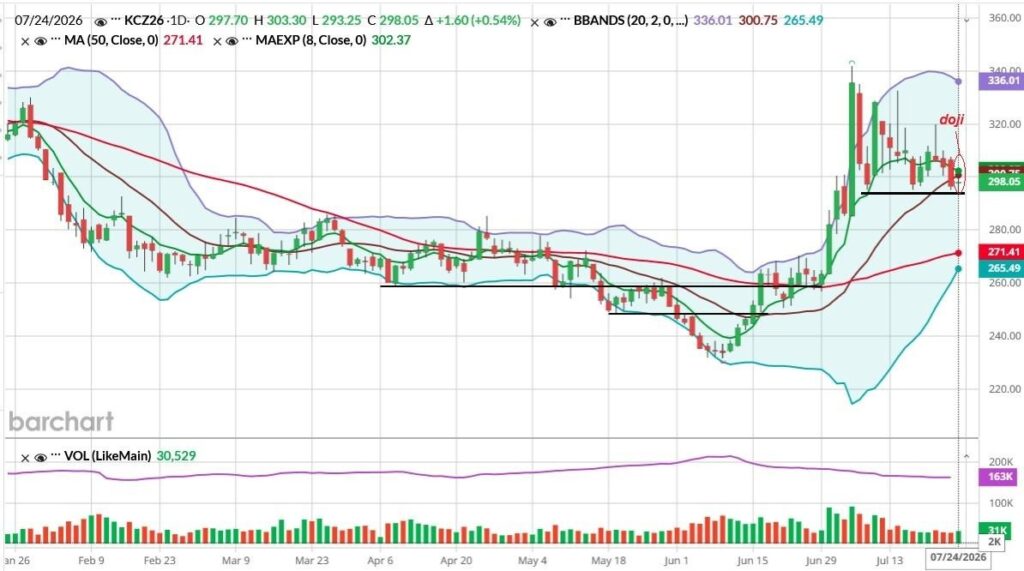
De allí se les acabó el gas a los fondos, el movimiento del precio se convirtió en un montaña rusa y se luego se desarrolló lateralmente alrededor de los 300 centavos. El viernes pasado el cierre fue justo debajo en 298.05.
Estamos usando la segunda posición diciembre, porque septiembre está a un fuerte premio de 13 a 20 centavos y es aún más volátil. El First Notice Day es hasta el 22 de agosto.
Después de meses de estar a la baja, el precio en Nueva York comenzó a subir a mediados de junio. El aumento del precio se aceleró a partir del 30 de junio. Causando cierto pánico en la bolsa y el 6 de julio el precio explotó, llegando al precio más alto en 5 meses y medio.
La principal causa es, como muchas veces, el tiempo en Brasil. Exceso de lluvias que retrasan la cosecha en Brasil y otros países, como Perú. Productores brasileños que retienen café, porque no saben cuánto café van a tener y de qué calidad. Preocupación por el posible impacto de El Niño en la próxima cosecha. Miércoles y jueves el precio bajó, entre otros por el reporte de FAS USDA que pronostica un fuerte excedente en la nueva cosecha.
La inestabilidad geopolítica, la crisis energética por la guerra en Medio Oriente, la paridad del dólar con el real brasileño y otras monedas, los bajos inventarios, los constantes cambios en las políticas de Trump y el anuncio de nuevas tarifas, etc. Después del bloqueo del estrecho de Ormuz por Estados Unidos e Irán, ahora también del estrecho de Bab al-Mandab entre Yemen y Yibuti, que da acceso al Mar Rojo y el Canal de Suez, por los Hutíes.
Todo impacta en los mercados financieros y la economía mundial, aumenta los precios de casi todos los productos y servicios, mucha volatilidad en los precios de materias primas.
Pero hay otro factor importante: los margin calls (los márgenes) en la bolsa. En la semana del 6 de julio, cuando explotó el precio de café, se aumentó el margen dos veces, forzando a muchos a abandonar sus posiciones por falta de liquidez, sobre todo comerciantes, con productores y tostadores detrás. Con eso los especuladores, que tienen bolsas más profundas, tuvieron las manos libres para mover el precio a su conveniencia.
El precio en el mercado de futuros se desligó aún más del precio en el mercado físico. Esto aceleró enormemente el aumento del precio y aumentó fuertemente la volatilidad. El 6 de julio la Banda de Bollinger tuvo un acho de 94.35 centavos, de 214.55 a 308.90.
Los movimientos en el mercado fueron espectaculares, violentos y únicos y se establecieron nuevos récords. De la baja el 9 de junio al máximo el 6 de julio el precio subió 110 centavos, de un mínimo de 231.80 a un máximo de 341.80, el precio más alto desde principios de enero.
El 6 de julio el precio subió 49.10 centavos en el cierre (segunda posición diciembre), de 286.30 a 335.40. El récord anterior de variación en 1 día fue de 47.00 centavos. El mismo día la diferencia entre precio máximo y precio mínimo fue de 56.55 centavos (341.80-285.25). El récord anterior fue 35.05 centavos.
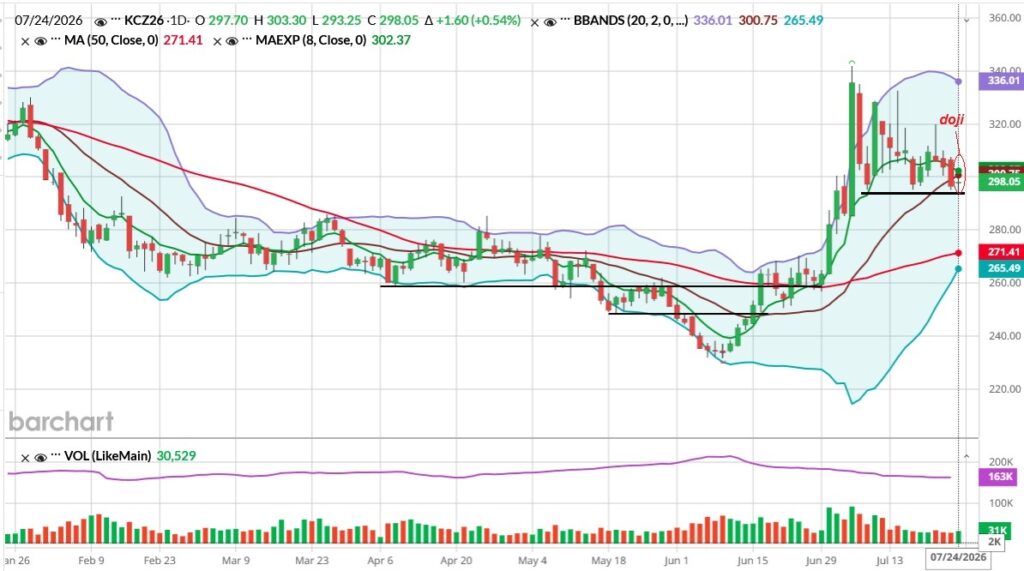
Para dónde se va a desarrollar el precio es difícil de pronosticar, como casi siempre. El viernes se formó un doji (ver el gráfico del precio diario abajo), porque la apertura y el cierre fueron casi iguales, el mercado no se decide si seguir lateralmente, bajar más o volver a subir.
El gráfico diario está a punto de dar una señal de venta (el gráfico de 4 horas ya la dio el miércoles, 22 de julio) como se observa en el gráfico, porque el promedio móvil exponencial de 8 días está por caer debajo del promedio móvil simple de 20 días. Al otro lado, el precio se mantiene muy por encima del promedio móvil de 50 días.
Soportes: 293.25, 285.25, 256.90, 250.55 y 231.80. Resistencias: 300.75 (eje). 319.95, 341.80.
El Commitment of Traders report muestra que el interés abierto de futuros y opciones combinados bajó en las últimas 3 semanas de 14,282 contratos de 234,963 a 220,681. El interés abierto de solo futuros bajó, de 180,244 a 163,222 el jueves pasado. El máximo se alcanzó en la primera mitad de junio con 215,469, para agarrar impulso para el rally impresionante. El volumen diario alcanzó hasta 91 mil contratos cuando el precio estuvo en su auge, luego bajó a alrededor de 30 mil.
La posición neta de los fondos de nuevo ha salido del territorio negativo, subió a 10,583 netos largos. Los spreads, que reflejan el grado en que cada operador no comercial mantiene posiciones largas y cortas combinadas, inicialmente subieron a 106,349,pero luego bajaron a 90,569. Muestra que muchos fondos no están tomando posición ahora.
La posición larga de los comerciales, bajó 5,749 lotes a 52,582. Los tostadores se rehúyen a fijar con estos niveles de precio. Además estamos entrando a la época de verano en los principales país consumidores, cuando el consumo tradicionalmente baja.
La posición corta de los comerciales subió, con 3,539 lotes a 99,328. La semana anterior. Cuando los precios estuvieron más altos, estuvo en 102,586. Los productores aprovecharon el rally del precio para fijar contratos.
Los fondos de índice volvieron a la carga, agregando 5,181 contratos para una posición neta larga de 34432. Casi todo por agregar largos.
Las tarifas de importación especiales del gobierno de Trump expiraron, muchas fueron eliminados por la corte suprema de justicia, por carecer de base legal. Trump anunció nuevas tarifas de 10% o 12.5% para 60 países, entre otros con el argumento que no hacen lo suficiente para eliminar el trabajo forzado. A ver si el argumento es aceptado por la corte.
El café verde está exento y café instantáneo de Brasil también. A Brasil se le impone una tarifa de 25% por razones políticas (no quiere a Lula, apoya a Bolsonaro) y se teme que Nicaragua también vaya a tener una tarifa más alta por el anuncio del gobierno de Ortega que ya no van a haber elecciones.
La Comisión Europea agregó justamente varios productos entre ellos el café instantáneo a la lista que tiene que cumplir con las reglas de EUDR (contra deforestación) a partir del 30 de diciembre 2027. El Parlamento Europeo todavía puede oponerse a las medidas.
Mientras Brasil ha visto bajar las exportaciones de café arábica natural, Etiopía ha llenado en parte el hueco, aumentado el volumen de exportación. China ha rebasado a Estados Unidos como tercer país destino, detrás de Arabia Saudita y Alemania. Las exportaciones a China crecieron 30% el año -asado, gracias a una fuerte campaña de promoción contra los líos con las tarifas en Estados Unidos.
El consumo en China está creciendo mucho, sobre todo entre los jóvenes, que va a impactar más en el futuro. China está realizando fuertes inversiones en Etiopía y, junto con Uganda se está invirtiendo en aumentar la producción, como hemos reportado anteriormente (Analizando la caída del precio, El precio se recupera, la economía se deteriora y la visión de la OIC).
Perú tiene fuertes tensiones en el mercado interno de café. La cosecha se ha retrasado y hay una creciente competencia por el poco pergamino que está disponible, que hace subir los precios internos. En la región de San Martín, Amazonas, la cosecha tiene un avance de un 70%, pero en el resto del país solo 35-45%. Se esperaba que la producción bajara esta cosecha entre 10% y 20%, pero ahora se está analizando que podría bajar hasta en un 40%.
Los altos precios internos todavía no se reflejan mucho en los diferenciales de exportación. Como casi todo el café se procesa en finca y se acopia en pergamino seco, los productores pueden retener el café, esperando un mejor precio.
Se teme un incremento de los defaults de septiembre en adelante.
El 22 de julio FAS USDA ha publicado su reporte anual sobre oferta y demanda mundial de café. En blogs de mayo y junio hemos presentado datos de los reportes por país y un balance de oferta y demanda mundial provisional (vean El pronóstico de FAS USDA y malas noticias para el precio y Analizando la caída del precio). Si quieren armar sus propias tablas dinámicas, la base de datos desde 1960 se encuentra aquí: https://apps.fas.usda.gov/psdonline/app/index.html#/app/downloads.
Contiene un análisis de la situación en Brasil, resume los cambios en los volúmenes de Vietnam, Centroamérica y México, Colombia, Etiopía, Indonesia y a nivel mundial Si no manejan el inglés, van a necesitar un traductor.
Con los datos completos, la tabla de oferta y demanda sería así (en miles de sacos):
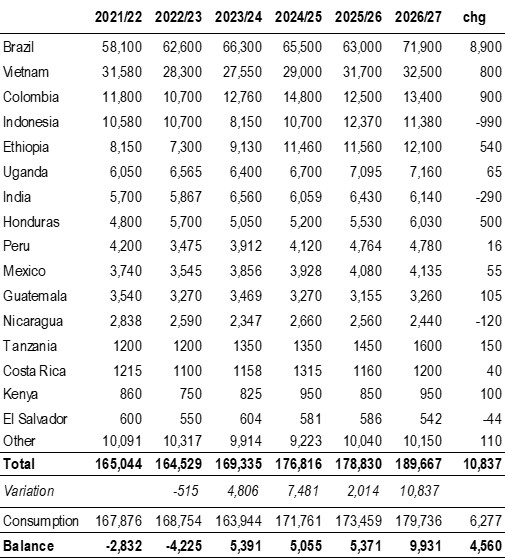
La oferta aumentará 10.8 millones de sacos (5.7%) a 189.7 millones. La demanda incrementará 6.3 millones de sacos (3.5%) a 179.7 millones. Resultará un excedente de 9.9 millones de sacos, casi el doble de los años anteriores.
Hemos comentado en el pasado que FAS USDA presenta la mayoría de las veces un excedente, la única excepción aquí son los ciclos 2021/22 y 2022/23. Esto en los últimos años sería poco probable, viendo la escasez en el mercado y los muy altos precios desde septiembre 2024 (arriba de 250).
Es posible que se haya guardado café para hacer subir el precio, pero en los últimos 3 ciclos sería un acumulado adicional de más de 15 millones de sacos extra en bodega, mientras se reporta bajos inventarios (24.4 millones de sacos en el ciclo pasado). Otras fuentes han reportado un déficits importantes desde 2022 y los señalan como principal causa de los altos precios.
Los datos de FAS USDA son muy completos y útiles y accesibles, sin ningún costo. Sobre todo la base de datos se presta para hacer diferentes tipos de análisis. Sin embargo, el sesgo sistemático en los datos le resta valor. Hemos comparado los datos de FAS USDA con los de la OIC (menos accesible, menos fácil de manejar y se tiene que pagar casi todo ahora), que tiene un sesgo parecido pero al revés: la mayoría de las veces la OIC reporta un déficit. Sacar un promedio entre las 2 fuentes es una forma sencilla para acercarse más a la verdad.
Jos Algra es consultor internacional con más de 40 años de experiencia en café y trabajar con organizaciones de productores.
Este blog fue publicado originalmente en Claase: https://claase.org/analisis-de-los-precios-del-cafe