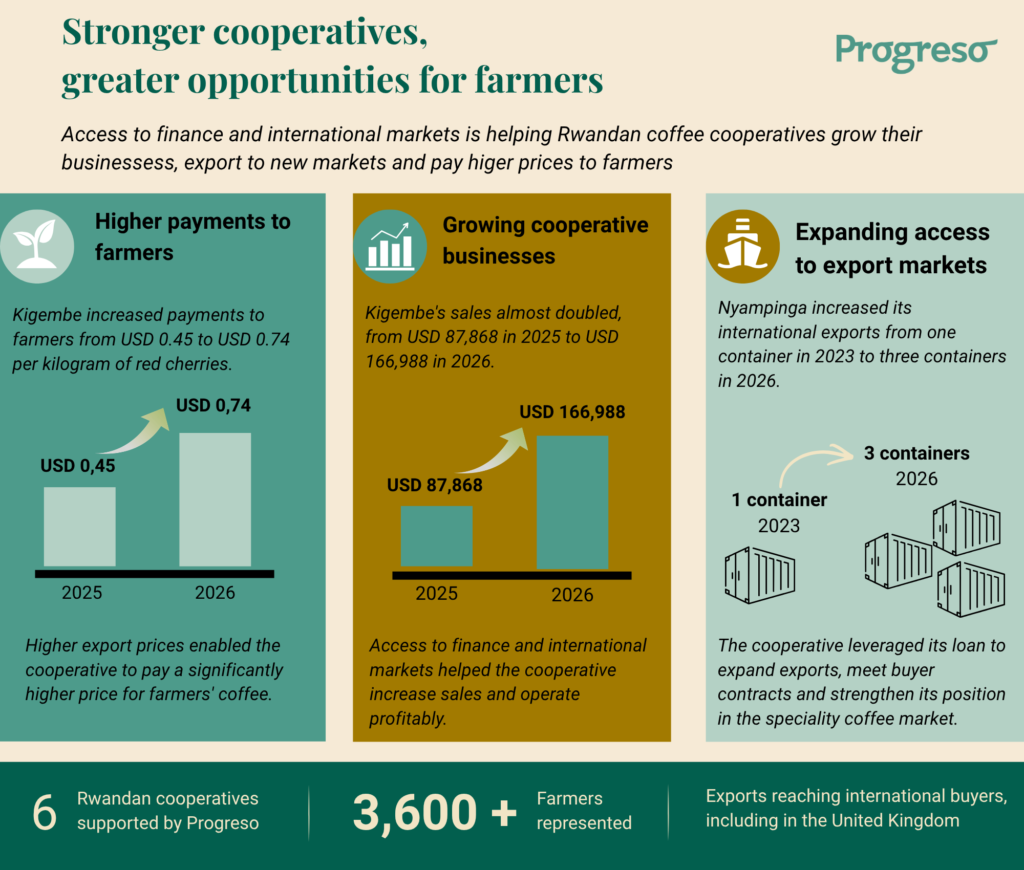
This year, three Rwandan coffee cooperatives, Buhanga, Kigembe and Nyampinga, received their first financing from Progreso, helping them strengthen their businesses and expand their market opportunities. For Buhanga and Kigembe, this support contributed to an important step: completing their first international coffee exports, with shipments reaching buyers in the United Kingdom. The three cooperatives are part of a wider group of six Rwandan cooperatives supported by Progreso, representing more than 3,600 farmers.
From access to finance to access to markets
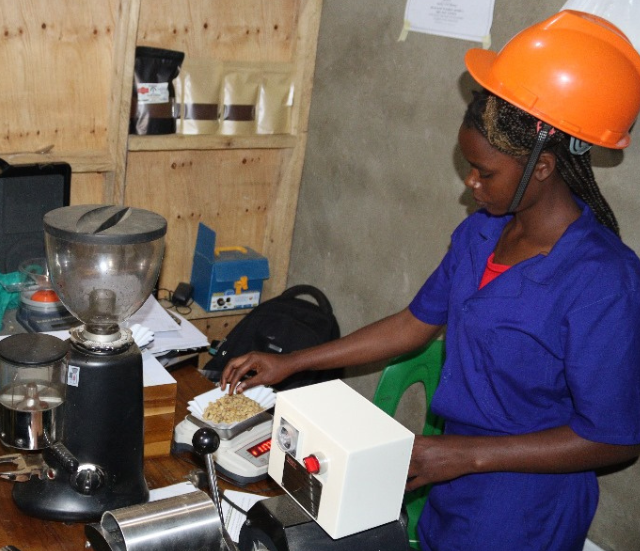
For coffee cooperatives, fulfilling international orders requires more than producing high-quality coffee. They need working capital to purchase coffee from farmers, cover processing and logistics costs, and meet buyers’ quality and documentation requirements before receiving payment for their exports. Access to finance helps bridge this gap, enabling cooperatives to purchase coffee from their members, fulfil orders and explore new markets.
The results are becoming visible in the cooperatives’ business performance. Kigembe has nearly doubled its sales compared with 2025, while Buhanga has strengthened its financial position. Nyampinga, meanwhile, has expanded its international exports, increasing shipments from one container in 2023 to three in 2026.
Better market access, better returns for farmers
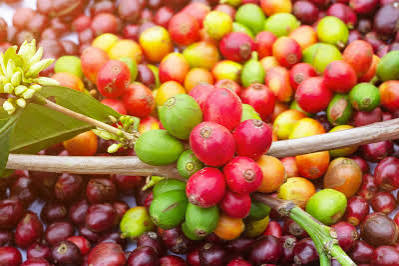
Access to international markets has also enabled Buhanga and Kigembe to offer farmers higher prices for their coffee. In 2026, payments to farmers increased from USD 0.45 to USD 0.74 per kilogram of red cherries compared with the previous year. For farmers, higher payments can make a tangible difference to household incomes and the ability to invest in their families and farms.
Esperance Nyiransabimana, a coffee farmer supplying Kigembe Cooperative, increased the volume of red cherries she delivered to the cooperative’s coffee washing station from 2,257 kilograms in 2024 to 4,000 kilograms in 2025. “I never expected that coffee from my farm would be appreciated by people in Britain,” she explained.
Her experience illustrates how stronger cooperatives and access to new markets can create opportunities for farmers to grow their production and benefit from the coffee they cultivate.
A foundation for continued growth
For Progreso, these first three financing operations in Rwanda represent an important step in building relationships with cooperatives and demonstrating what access to finance can enable. All three loans have been repaid in full, providing a positive foundation for continued collaboration. By combining access to finance with stronger market connections, Progreso aims to help cooperatives develop their businesses, reach new buyers and create lasting opportunities for the farmers they represent.
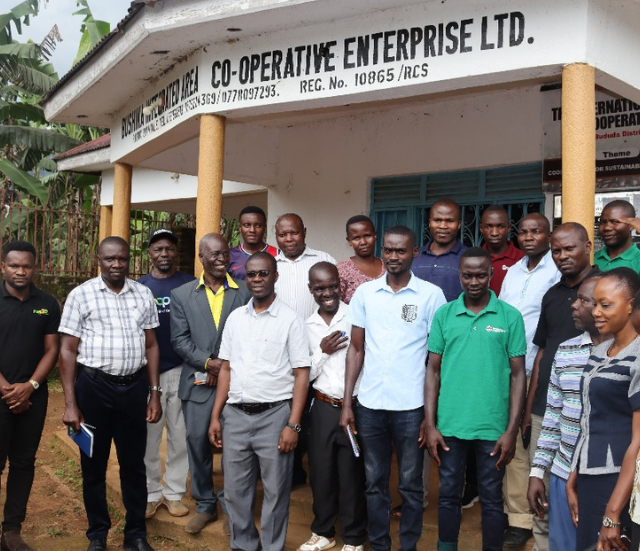
On the slopes of Mount Elgon in eastern Uganda, Arabica coffee grows at altitudes of 1,500–2,300 metres above sea level. For the Bushika Integrated Area Cooperative Enterprise (BIACE), the challenge is not only to produce quality coffee, but also to create greater value for the farmers who grow it.
BIACE is a farmer-owned cooperative based in Bududa District, bringing together smallholder farmers through a network of primary cooperatives. Its work focuses on improving coffee production, strengthening collective marketing and opening doors to higher-value markets.
Building value from farm to buyer
The cooperative’s commitment to quality is reflected in its approach to processing and marketing. BIACE works with Arabica varieties including SL14, SL28 and Nyasaland, and processes coffee for export. Its approach combines quality improvement with traceability, helping connect coffee from farmers’ fields to buyers.
For the 2 December 2026 Beyco Uganda Coffee Auction, BIACE is presenting Bududa Slopes Natural, a naturally processed Arabica lot grown on Mount Elgon’s volcanic soils. The auction profile describes a cup with citrus and red berry notes, a bold, juicy body and a balanced finish. Grown at high altitude and prepared using a parabolic drier, the lot offers buyers a taste of the region’s coffee and an opportunity to discover BIACE as a sourcing partner.
Coffee, trees and diversified livelihoods
Coffee is central to BIACE’s work, but it is part of a broader vision for rural livelihoods. The cooperative and its farmers have planted more than two million trees, supporting agroforestry and environmental conservation around Mount Elgon. BIACE also promotes beekeeping and organic honey production, alongside dairy and banana wine enterprises, to diversify income beyond coffee.
These activities reflect a practical approach to resilience: strengthening coffee production while supporting other enterprises that can contribute to household incomes and local economic opportunities.
Connecting producers with new markets
Through the Beyco auction, BIACE can showcase a specific coffee lot to international buyers and explore new commercial relationships. For buyers, it is an opportunity to discover coffee from Mount Elgon while learning more about the cooperative and the farmers behind it.
The auction is more than a chance to taste a new coffee. It is a step towards connecting producer organizations with buyers who value quality, traceability and the people and landscapes behind each lot.
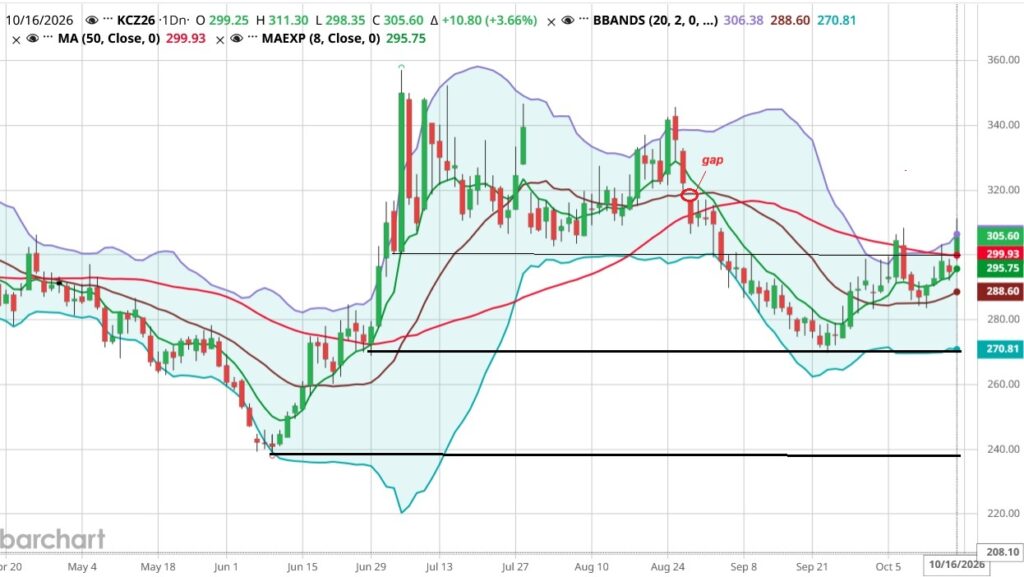
El pecio de café en Nueva York tuvo un fuerte impulso el 6 de octubre, subiendo 11.40 centavos para cerrar en 304.45. El día siguiente subió más, hasta 308.35, pero luego se desplomó y cerró en 292.70. En los siguientes días tocó fondo en 283.30, pero en esta semana volvió a subir, destacándose el viernes, cuando llegó a 311.30 y cerró en 305.60, un aumento de 10.80 centavos en el día.
Inicialmente el pecio aumentó por la preocupación por el impacto que el “Súper El Niño” puede tener en la producción de café en países importantes como Brasil, Vietnam e Indonesia a finales de este año.
A eso se agregó el fortalecimiento del real brasileño ante el dólar, porque el candidato de la derecha Flavio Bolsonaro – hijo de Jair Bolsonaro, el expresidente que está preso por un intento de golpe de estado – llevó ventaja sobre el actual presidente Lula da Silva en la primera ronda de las elecciones presidenciales. El fortalecimiento del real frena las ventas para las exportaciones por parte de los productores.
Luego el sentimiento cambió ante la perspectiva de un fuerte aumento de las exportaciones en esta cosecha y de la oferta de café en la próxima temporada en Brasil.
El viernes de la semana pasada la Federación Nacional de Cafeteros FNC de Colombia reportó una baja sensible en la producción y las exportaciones de café en el ciclo 2025/26. Esta noticia impulsó el aumento del precio en esta semana.
El jueves una baja del precio, pero el viernes un fuerte aumento por la renovada preocupación por el impacto de El Niño. El ministerio de agricultura de Vietnam expresó que Vietnam puede sufrir de una fuerte sequía al final de 2026 e inicio de 2027, cuando está en plena cosecha.
El precio ha roto la resistencia sicológica de 300 centavos y ha alcanzado un máximo de 311,30 el viernes. La siguiente resistencia es la brecha de 317.00-319.80 que quedó desde finales de agosto. El mercado sigue en modo de compra, pero está ligeramente sobrecomprado, lo que puede dar lugar a una corrección.
Además hay indicadores de que el backwardation podría llegar a su fin, lo que cambiaría el panorama del precio, como se argumenta más adelante.
Hacia abajo hay una serie de soportes, el primero el promedio móvil de 50 días en 299.95, que se ha superado el viernes, igual que el promedio móvil de 100 días en 296.15. Pisos importantes están justo debajo de 270 y 240.
Soportes: 299.95 (MA50), 292.60, 283.50, 269.75, 260.15 y 238.85. Resistencias: 311.30, 317.00-319.80 (gap) y 333.05.
En el Commitment of Traders report el interés abierto de futuros y opciones combinados subió primero de 197,518 hace 2 semanas a 208,283 la semana, pero luego bajó a 201,085, un aumento neto de 3,567 contratos. El interés abierto de solo futuros subió igual que la quincena pasada, de 157,890 a 166,525 el jueves pasado, un aumento de 8,635 contratos. El volumen diario promedió casi 33 mil contratos y repuntó el viernes con más de 53 mil.
La posición de los fondos primero se redujo de 3,493 a 1,160 neto corto, pero luego se amplió de nuevo a 3,697 neto corto, un cambio neto de -204. Los spreads, que reflejan el grado en que cada operador no comercial mantiene posiciones largas y cortas combinadas, subieron 1,873 contratos de 67,463 a 69,336.
La posición larga de los comerciales primero subió de 59,573 a 61,030, pero luego bajó a 59,679, un cambio neto de 106 contratos. La posición corta de los comerciales primero subió de 91,004 a 95,551, pero luego bajó a 91,170, un cambio neto de 166 contratos.
Los fondos de índice aumentaron su posición neta larga con 578 contratos de 33,943 a 34,518.
El sentimiento en la bolsa de Nueva York se sigue animando y con el aumento del precio en esta semana se espera un cambio importante en el Commitment of Traders report del próximo viernes.
Normalmente un mercado de futuros de una materia prima como café está en modo de contango, posiciones futuras tienen un premio para compensar el costo para cargar con el producto: bodegaje, seguro e intereses. En el caso de café en la historia reciente ese premio ha sido 2-3 centavos entre una posición y otra. La diferencia entre los precios por posición se conoce como spread.
En el blog del 8 de febrero de este año ¿Fin de la bonanza?he analizado como el mercado de café está en modo de backwardation, desde el 17 de octubre 2023, es decir el mercado está invertido, en vez de un premio hay un descuento para posiciones futuras. Las posiciones más cercanas tienen un premio debido a la escasez de café a corto plazo.
Esta situación atípica ya dura 775 días de mercado o 1,095 días calendarios (3 años) y es la más prolongada en la historia. El segundo período más prolongado fue de 1996-1998 con 527 días de mercado o 842 días calendarios.
Un mercado en backwardation es más difícil de manejar para el comercio y tiende a subir el nivel del precio en general debido a la escasez a corto plazo. Esta situación podría llegar a su fin en un futuro próximo, con que debería de bajar el nivel general del precio. La escasez de café en los últimos años se va a cambiar a un excedente de cerca de 10 millones de sacos, según los pronósticos. Este cambio en el balance entre oferta y demanda se está manifestando en los precios en la bolsa de Nueva York.
El descuento de la segunda posición en Nueva York (ahora marzo) sobre la primera posición (diciembre) se está reduciendo. De un máximo de 36.10 centavos todavía en agosto de este año, se ha bajado a 7-8 centavos en el último mes, desde que diciembre desplazó a septiembre como posición principal, aunque jueves-viernes volvió a subir a 10-11 centavos. El descuento sobre todo el año ha bajado de un máximo de 75.55 centavos a 15-16 centavos en promedio últimamente. Estos precios están reflejando un alivio sostenido en la escasez inmediata de café Arábica en el mercado físico.
CONAB en su último pronóstico de cosecha reporta 2.35 millones de hectáreas cultivadas con café, con un rendimiento promedio de 34.6 sacos de 60 kg por hectárea, una aumento de 13.8%. Además hay más de 400 mil hectáreas en formación. Esto da un potencial productivo 75–80 millones de sacos en 2027/28 y más de 90 millones hacia 2029/30.
El promedio de las estimaciones de cosecha 2026/27 en Brasil es 72-73 millones de sacos. Excluyendo las de CONAB (67.6 millones) e IBGE (66.8 millones), las fuentes que notoriamente subestiman el volumen de producción, el promedio es 73-74 millones de sacos. Sumando los inventarios iniciales de 7-8 millones, tenemos una oferta total de 79-82 millones de sacos.
Si le restamos el consumos doméstico de 22 millones, quedan 57-60 millones. Se espera que quedará un inventario final de 9-10 millones, entonces habrá una saldo exportable de 48-50 millones de sacos, contra un volumen exportado de 38.5 millones en el ciclo 2025/26, un aumento de 25-30% y arriba del récord de 47.4 millones en la cosecha 2023/24.
Esto va a pesar fuertemente sobre el precio de café en el mercado mundial. Lo que hay que monitorear es el volumen mensual de exportaciones, para ver cuánto café está efectivamente saliendo al mercado. 48-15 millones en la cosecha son 4-4.2 millones de sacos al mes. En lo que va de este ciclo (julio-septiembre) el promedio es 3.7 millones.
La Federación Nacional de Cafeteros de Colombia reporta una baja de la producción de 15% a 12.7 millones de sacos en la cosecha pasada, que va de octubre 2025 a septiembre 2026. Las exportaciones bajaron 12% a 11.8 millones de sacos.
Jos Algra es consultor internacional con más de 40 años de experiencia en café y trabajar con organizaciones de productores.
The price of coffee in New York saw a strong boost on October 6, rising 11.40 cents to close at 304.45. The following day, it climbed further to 308.35, but then plummeted, closing at 292.70. In the days that followed, it hit a low of 283.30, but it rebounded this week, most notably on Friday, when it reached 311.30 and closed at 305.60, an increase of 10.80 cents for the day.
Initially, the price rose due to concerns regarding the potential impact of a “Super El Niño” on coffee production in major producing nations such as Brazil, Vietnam, and Indonesia later this year.
Compounding this was the strengthening of the Brazilian real against the U.S. dollar, driven by the fact that right-wing candidate Flavio Bolsonaro – son of former president Jair Bolsonaro, who is currently imprisoned for an attempted coup – led in the first round of the presidential elections against current President Lula da Silva. A stronger real tends to discourage producers from selling their coffee for export.
Subsequently, market sentiment shifted due to expectations of a significant surge in exports for the current harvest, as well as an increased supply of coffee from Brazil for the upcoming season.
Last Friday, Colombia’s National Federation of Coffee Growers FNC reported a notable decline in both coffee production and exports for the 2025/26 cycle. This news fuelled the price increase seen this week.
After a price drop on Thursday, there was a sharp rally on Friday, driven by renewed concerns regarding the impact of El Niño. Vietnam’s Ministry of Agriculture indicated that the country could face severe drought conditions between late 2026 and early 2027, a period that coincides with the peak of the harvest season.
The price has broken through the psychological resistance level of 300 cents, reaching a high of 311.30 on Friday. The next resistance level is the gap between 317.00 and 319.80, which has persisted since late August. The market remains in a buying mode, though it is slightly overbought, which could lead to a correction.
Furthermore, there are indications that the state of backwardation may be coming to an end, a development that would alter the price outlook, as discussed further on.
On the downside, there are several support levels; the first is the 50-day moving average at 299.95, which was surpassed on Friday, as was the 100-day moving average at 296.15. Significant support floors lie just below 270 and 240.
Support: 299.95 (50-day MA), 292.60, 283.50, 269.75, 260.15, and 238.85. Resistance: 311.30, 317.00–319.80 (gap), and 333.05.
In the Commitment of Traders report, the combined Open Interest for futures and options first rose from 197,518 two weeks ago to 208,283 last week, but subsequently fell to 201,085, a net increase of 3,567 contracts. Open Interest for futures alone followed a similar trend to the previous two-week period, rising from 157,890 to 166,525 as of last Thursday, an increase of 8,635 contracts. Daily volume averaged nearly 33 thousand contracts and picked up on Friday, reaching over 53 thousand.
The position held by funds first narrowed from a net short of 3,493 to 1,160, but then widened again to a net short of 3,697, a net change of -204. Spreads, which reflect the extent to which each non-commercial trader holds a combination of long and short positions, increased by 1,873 contracts from 67,463 to 69,336.
The long position held by commercial traders first rose from 59,573 to 61,030, but then fell to 59,679, a net change of 106 contracts. The short position held by commercial traders first rose from 91,004 to 95,551, but then fell to 91,170, a net change of 166 contracts.
Index funds increased their net long position by 578 contracts, moving from 33,943 to 34,518. Sentiment on the New York exchange continues to improve, and with this week’s price increases, a significant shift is expected in next Friday’s Commitment of Traders report.
Typically, a futures market for a commodity like coffee operates in contango, where future positions carry a premium to offset the costs of carrying the product, such as storage, insurance, and interest. In the recent history of the coffee market, this premium has generally been 2–3 cents between consecutive contract positions. The price difference between these positions is known as a spread.
In my February 8th blog post, End of the bonanza?, I analysed how the coffee market has been in backwardation since October 17, 2023. In other words, the market is inverted: rather than a premium, there is a discount for future positions. Near-term positions command a premium due to a short-term scarcity of coffee.
This atypical situation has persisted for 775 trading days or 1,095 calendar days (3 years), marking the longest such period in history. The second-longest instance occurred between 1996 and 1998, lasting 527 trading days (842 calendar days).
A market in backwardation is more challenging for the trade to navigate and generally tends to drive up price levels due to short-term shortages. This situation may soon come to an end, which should lead to a decline in overall price levels. According to forecasts, the coffee scarcity experienced in recent years is set to shift toward a surplus of approximately 10 million bags. This change in the supply-demand balance is currently being reflected in prices on the New York exchange.
The discount of the second contract position in New York (currently March) relative to the first position (December) is narrowing. From a high of 36.10 cents as recently as August of this year, the figure has fallen to 7–8 cents over the last month, following the shift from the September to the December contract as the primary position, though it ticked back up to 10–11 cents on Thursday and Friday.
The discount for the full year has narrowed from a peak of 75.55 cents to an average of 15–16 cents of late. These prices reflect a sustained easing of the immediate shortage of Arabica coffee in the physical market.
In its latest crop forecast, CONAB reports 2.35 million hectares under coffee cultivation, with an average yield of 34.6 60-kg bags per hectare—an increase of 13.8%. Furthermore, more than 400,000 hectares are currently in the development phase. This points to a production potential of 75–80 million bags by 2027/28, and over 90 million by 2029/30.
The average of crop estimates for Brazil for 2026/27 stands at 72–73 million bags. Excluding figures from CONAB (67.6 million) and the IBGE (66.8 million)—sources known to consistently underestimate production volume—the average rises to 73–74 million bags. Adding initial inventories of 7–8 million bags brings the total supply to 79–82 million bags.
Subtracting domestic consumption of 22 million bags leaves a balance of 57–60 million bags. An ending inventory of 9–10 million bags is expected, leaving an exportable surplus of 48–50 million bags, compared to an export volume of 38.5 million bags in the 2025/26 cycle. This represents an increase of 25–30% and exceeds the previous record of 47.4 million bags from the 2023/24 harvest.
This will exert significant downward pressure on global coffee prices. It will be important to monitor monthly export volumes to track how much coffee is actually reaching the market. An annual total of 48–50 million bags translates to 4–4.2 million bags per month. So far this cycle (July–September), the average has been 3.7 million bags per month.
The National Federation of Coffee Growers of Colombia FNC reports a 15% decline in production, down to 12.7 million bags for the most recent harvest (covering the period from October 2025 to September 2026). Exports fell by 12% to 11.8 million bags.
Jos Algra is an international consultant with more than 40 years of experience in coffee and working with producer organisations.
This blog was originally published in Spanish in Claase:
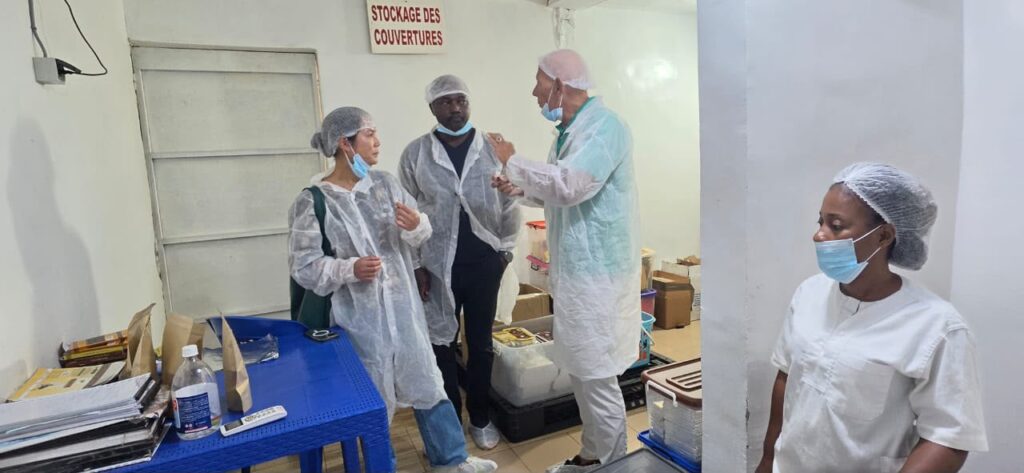
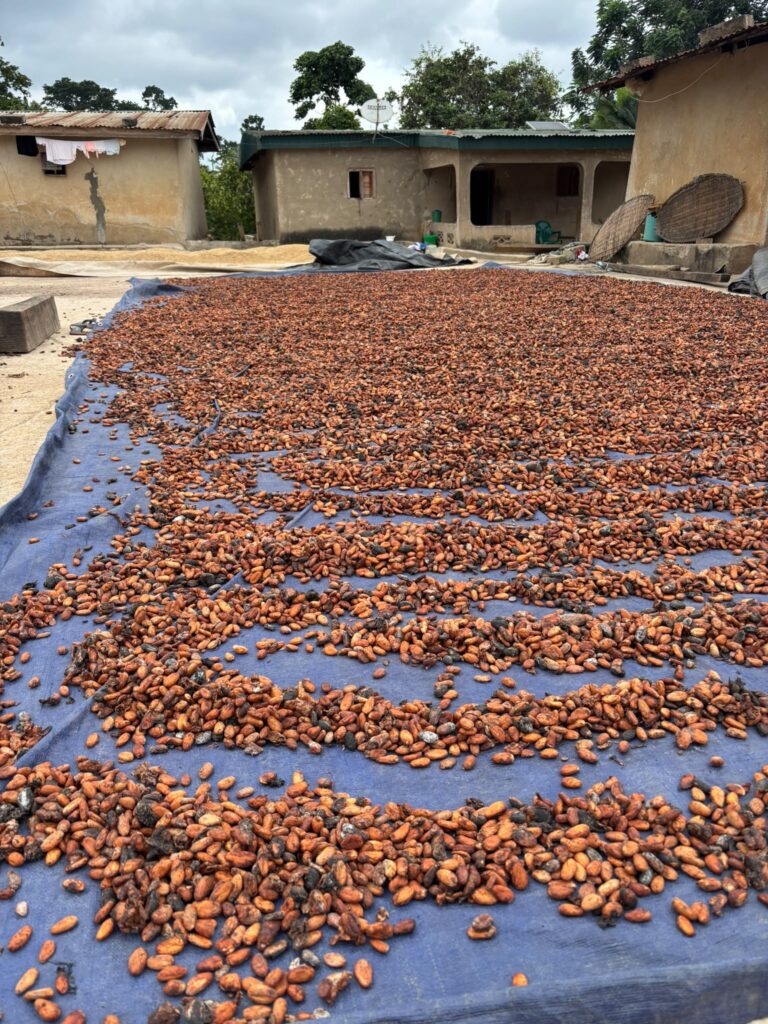
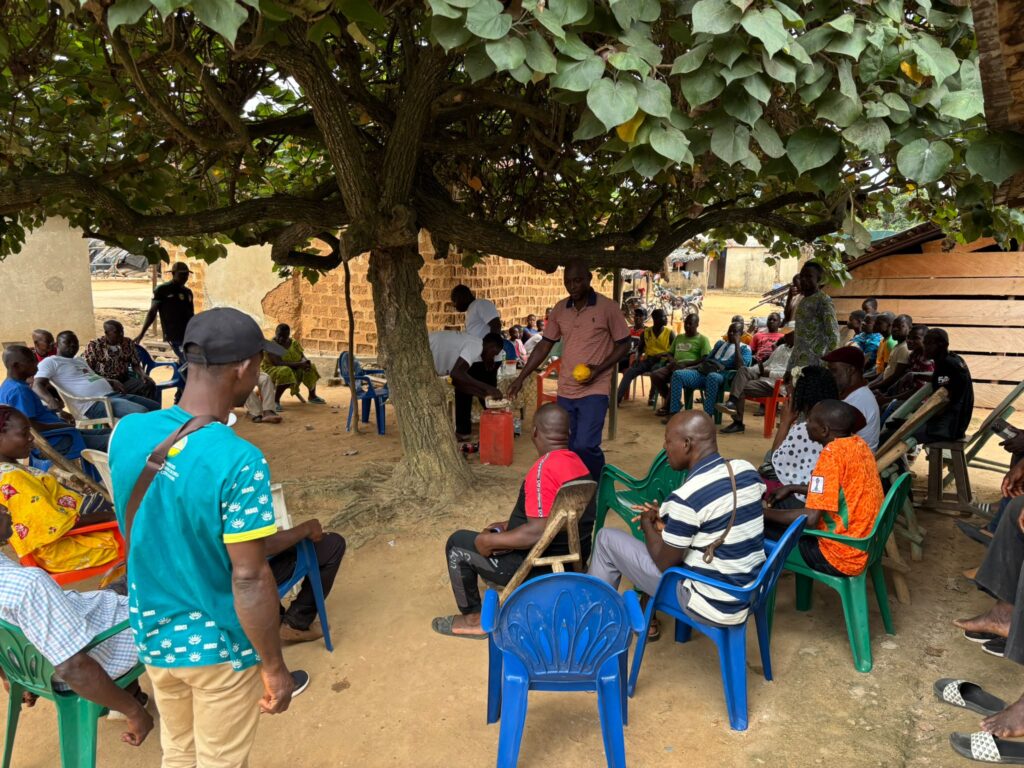
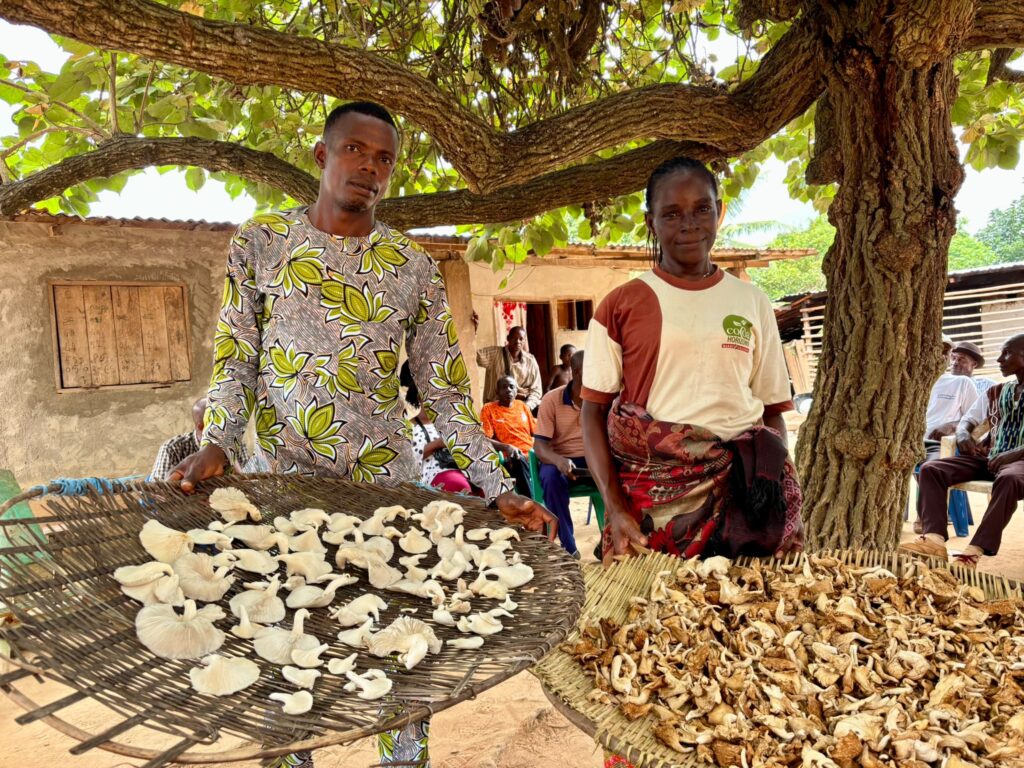
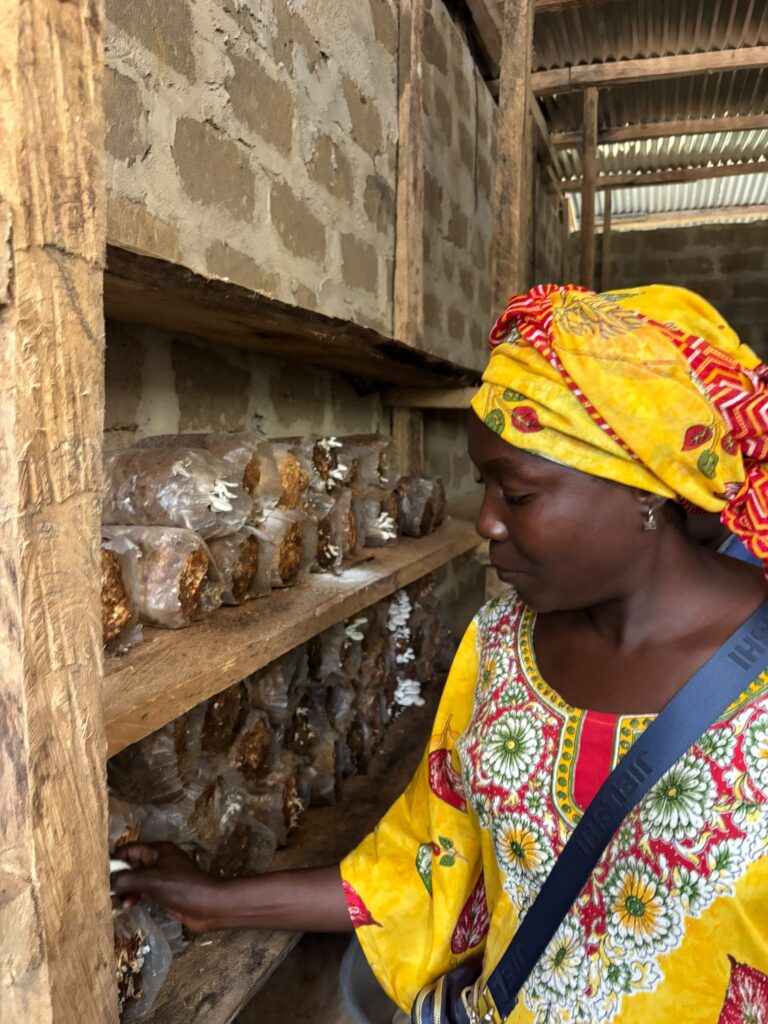
A small chocolate factory where much of the work is still done by hand, a cooperative experimenting with growing mushrooms on cocoa waste, and conversations about how producer organisations can work more closely together. For Bas Huurman, former owner of The Chocolate Family and co-founder of SEM Foundation, his recent visit to Côte d’Ivoire was an opportunity to see first-hand how different initiatives are developing and where opportunities for future collaboration lie.
Bas travelled to Côte d’Ivoire with An Ha, Managing Director of Progreso, as part of the collaboration between SEM Foundation and Progreso. SEM Foundation has been involved in initiatives in cocoa-producing countries for more than ten years. Building on the background of the family business The Chocolate Family, the foundation aims to give something back to the communities that produce cocoa. Through its collaboration with Progreso, SEM Foundation also contributes to strengthening producer organisations and developing the cocoa value chain.
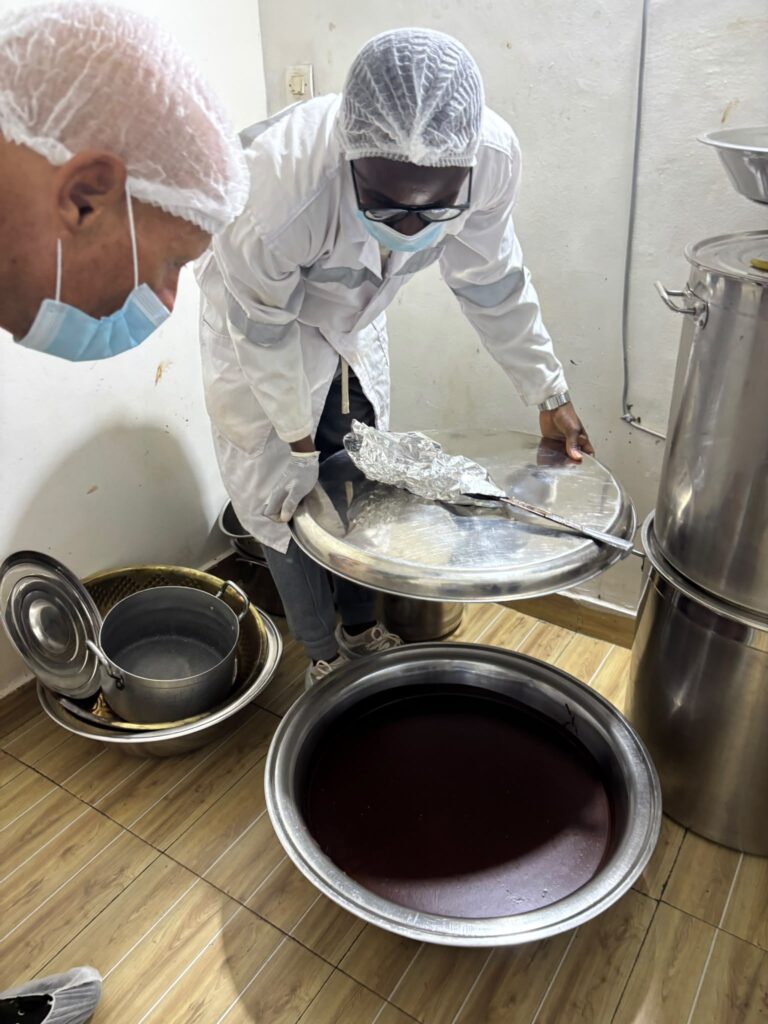
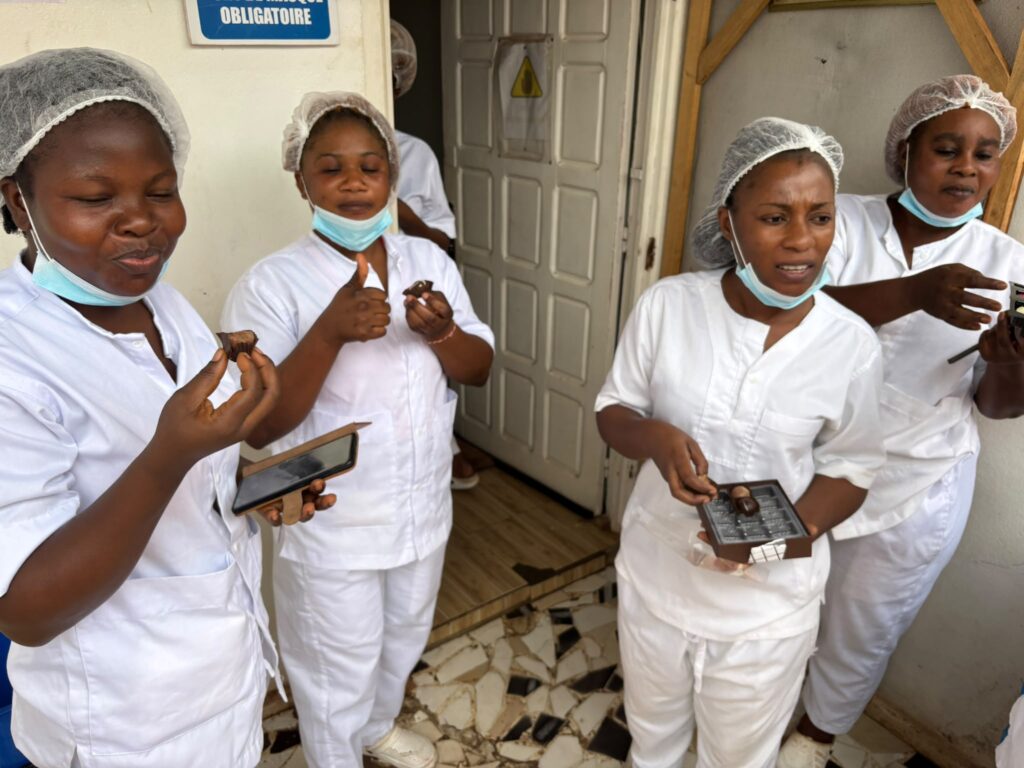
One of the visits that made the strongest impression on Bas was to Yecao, a small chocolate factory in which the cooperative CAMAYE holds a share. Located in Abengourou, the capital of the Indénié-Djuablin region in eastern Côte d’Ivoire, the factory produces organic cocoa products, semi-finished products and flavoured chocolates, including varieties with ginger, cashew, coconut and lemongrass.
Production is still in its early stages, and much of the work is carried out by hand. What impressed Bas most, however, were the people. “I really appreciated the dedication of the people and their love for the product,” he says.
He was equally struck by their curiosity. Bas had brought some chocolate products from Belgium and was surprised by the level of interest they generated. “It was as if they were a giant sponge. They couldn’t ask enough questions.” For him, this was a wonderful example of the energy and ambition he encountered throughout the visit.
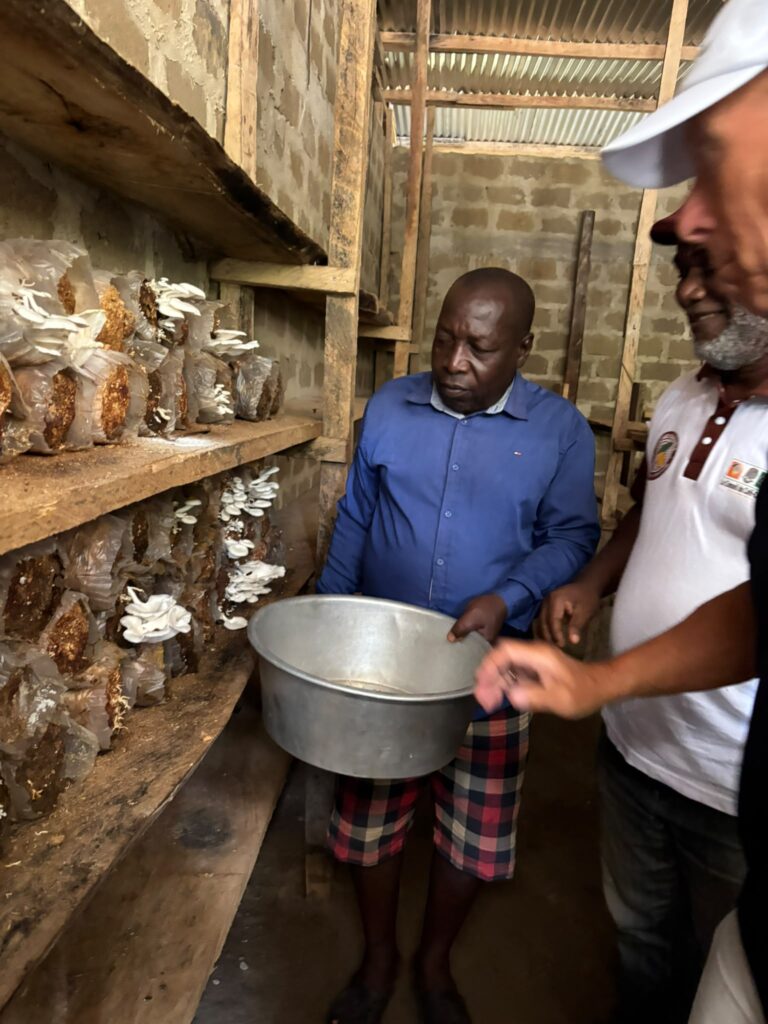
At the SCAOD cooperative in Diégonefla, Bas witnessed a different kind of innovation. There, the cooperative is experimenting with growing mushrooms using waste from cocoa production, turning a by-product into a potential additional source of income.
“I was very impressed by the way we were welcomed, but also by how grateful people were to have the opportunity to develop an additional income stream.”
According to Bas, these initiatives demonstrate that Côte d’Ivoire has opportunities beyond simply increasing cocoa production. At the same time, he sees considerable potential for better organisation and collaboration across the sector.
During his visit, a meeting had been planned with the chair of a cooperative involved in a merger process. Although the meeting could not take place due to the chair’s unexpected absence, the idea behind this collaboration remained an important part of Bas’s reflections on the visit.
Bas believes cooperatives stand to gain a great deal by seeing one another as colleagues rather than competitors. By joining forces, they could, for example, establish a joint marketing organisation and take on a more active role further along the value chain. The small chocolate factory he visited illustrates what can be achieved when producers explore ways to create more value from their own cocoa.
He also sees a role for organisations such as Progreso and SEM Foundation in making this happen. Their contribution goes beyond providing financial resources: they can bring different actors together, facilitate collaboration and help promising initiatives grow.
“It should create a ripple effect,” he says. If collaboration between cooperatives leads to better results, he believes it can inspire others to follow suit.
The visit reinforced Bas’s belief in the potential of Côte d’Ivoire, particularly if cooperatives work more closely together and receive stronger support to develop their businesses. It also reminded him, as a former chocolate entrepreneur, where chocolate really comes from: at the beginning of the value chain, with farming families cultivating small plots of land.
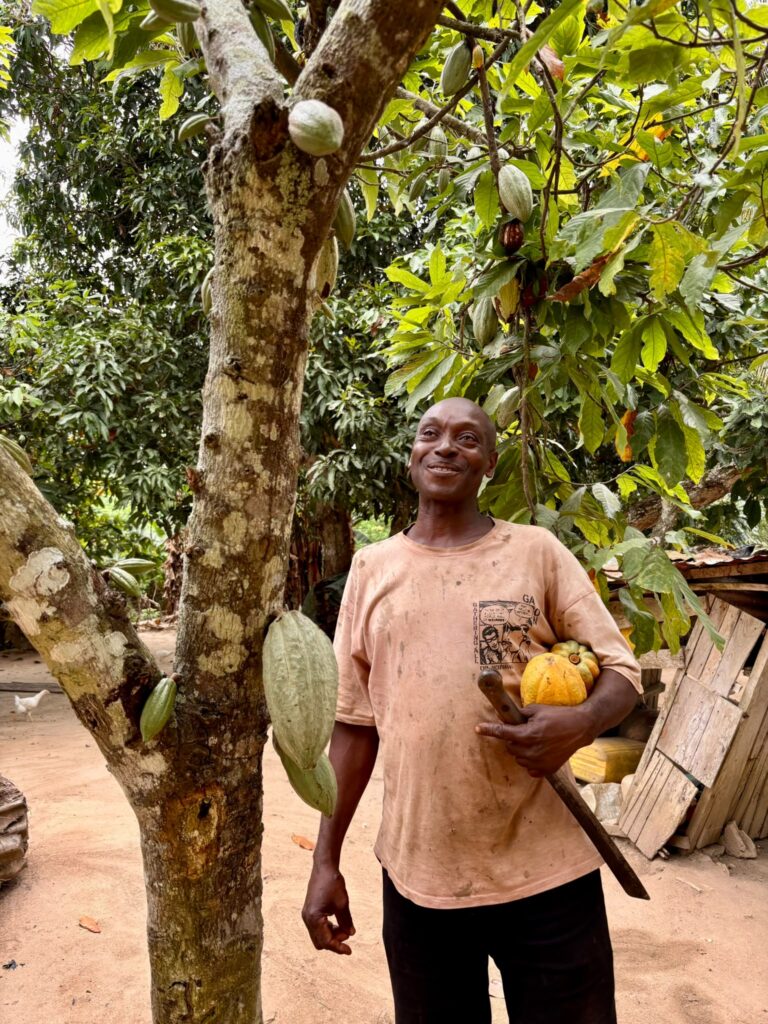
“One family has to make a living from one and a half hectares,” he explains. Families work together on their land and then bring their cocoa beans to the cooperative in large jute sacks.
For Progreso, the visit reinforced the importance of long-term collaboration with producer organisations. Building a stronger cocoa value chain requires more than financing. It also means supporting new ideas, connecting organisations and creating the space for people to experiment with new opportunities.
About SEM Foundation
SEM Foundation builds on the legacy of The Chocolate Family, supporting initiatives in cocoa-producing countries to give back to the communities behind cocoa production. Through its partnership with Progreso, the foundation helps strengthen cocoa producer organisations, encourage collaboration and support initiatives that diversify farmers’ incomes and contribute to a more resilient cocoa sector.
About Progreso Foundation
Progreso Foundation is a Dutch NGO that supports coffee and cocoa producer organisations in Africa, Latin America and Asia. By strengthening their business capacity, governance and access to finance and markets, Progreso helps cooperatives become more professional and resilient, contributing to improved livelihoods and more sustainable value chains for smallholder farmers.
For coffee and cocoa producer organisations, access to finance can open up business opportunities. But when harvests are uncertain, production is affected by climate and markets are unpredictable, financing alone is not enough. Building resilient organisations requires strong management, transparent governance and solutions that respond to farmers’ needs.
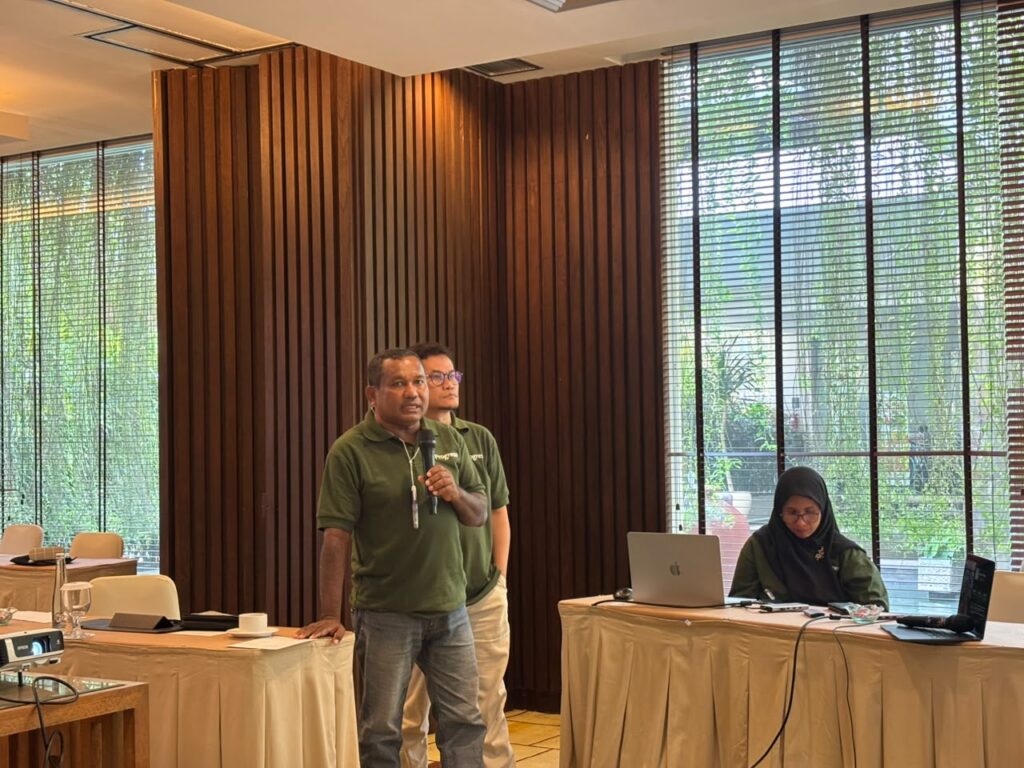
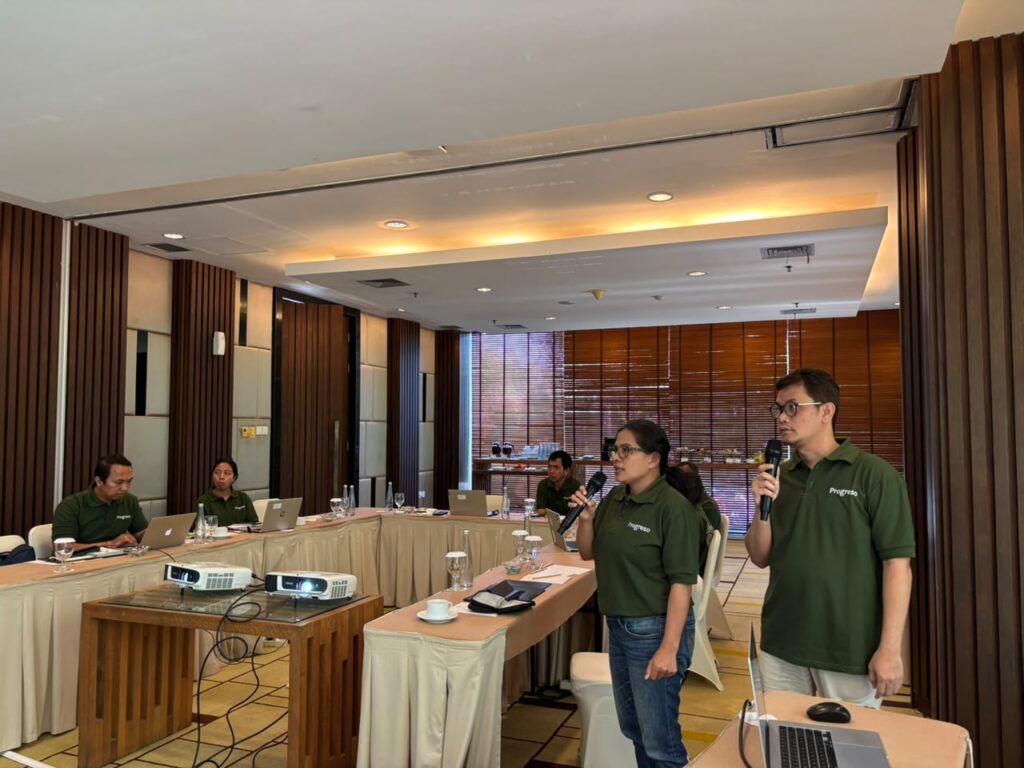
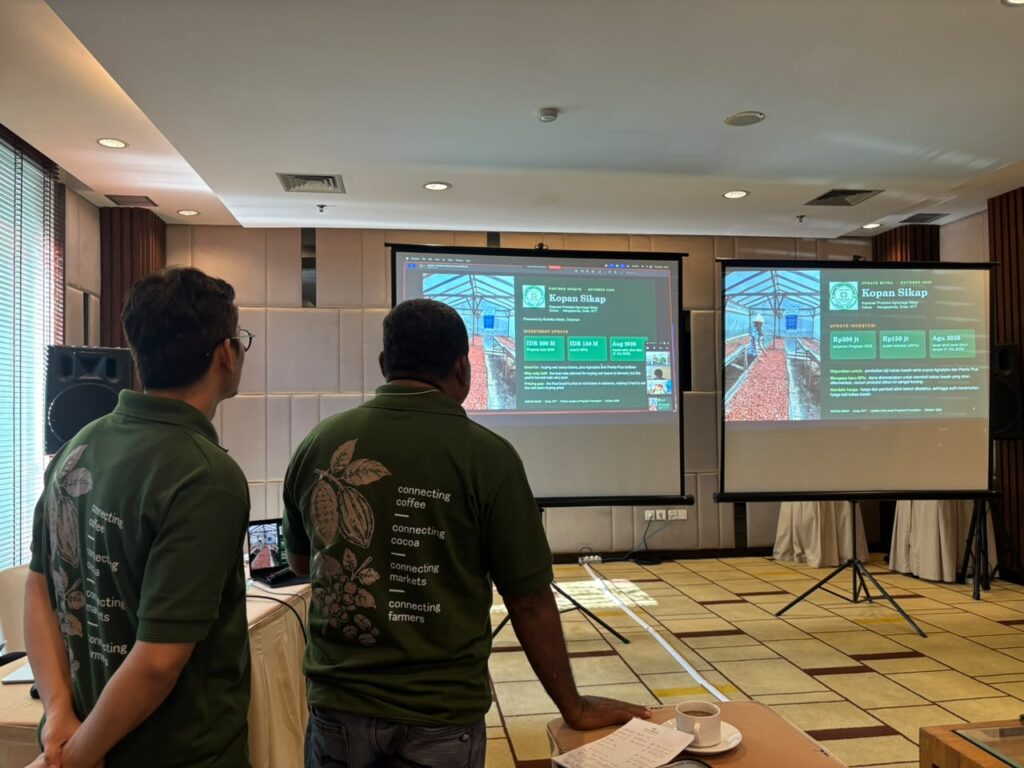
During a partner sharing session in Bali on 8 October 2026, Progreso representatives An Ha and Daan Mulder met in an online session with Indonesian coffee and cocoa partners to discuss their business progress, how they use working capital, the challenges they face and their priorities for the year ahead. The conversations offered a valuable reminder of the realities facing agricultural businesses and the importance of looking beyond financing alone.
Navigating an unpredictable growing season
For coffee and cocoa businesses, production depends on conditions that are not always within their control. For example, on the island of Flores, where the cocoa cooperative Kopan Sikap operates, production has been affected by difficult weather conditions, limited water and the impact of an earthquake. Lower harvests have made it harder for the cooperative to source the cocoa it needs to meet its business ambitions. However, the challenges have not diminished the partner’s determination to find a way forward. As one representative put it during the discussion:
“Things can change for the better, God will help, we are looking for a solution.”
This outlook reflects the importance of finding practical ways to adapt. For Kopan Sikap, priorities include improving its business planning, strengthening organisational capacity and finding ways to secure sufficient cocoa volumes while improving its readiness to reach new markets.
Coffee businesses face their own challenges. PT Kopi Toduri Jaya, based in Enrekang, South Sulawesi, reported that prolonged rainfall had contributed to lower coffee production, even as demand from existing and potential buyers increased. Sourcing from additional areas has been one way to respond to the supply shortfall. These experiences demonstrate how closely business performance is connected to production conditions, procurement strategies and access to markets.
Making working capital work
Working capital enables producer organisations and coffee businesses to purchase crops from farmers and cover the costs of processing and preparing products for sale. However, the amount of financing needed and how effectively it can be used depends on the realities on the ground. When harvests are smaller than expected, supply is uncertain or purchasing prices are difficult to match with selling prices, businesses may struggle to deploy their available working capital as planned.
During the sharing session, Progreso and its partners discussed the importance of aligning financing with harvest cycles, understanding market conditions and improving the information used to guide purchasing decisions. The discussion also highlighted the need to look beyond the immediate transaction. Sustainable businesses need to understand how their operations benefit farmers and how those farmers can participate in decisions that affect their organisations and livelihoods.
Strong organisations need more than finance
A key takeaway from the discussions was that financial support alone is not enough to build resilient farmer organisations. Cooperatives also need reliable financial records, transparent governance, clear responsibilities and effective purchasing systems. These foundations help organisations manage resources responsibly, make informed decisions and respond to changing circumstances. Progreso’s support therefore extends beyond financing. Its work with partners includes financial management training and coaching, governance support and assistance in strengthening organisational processes.
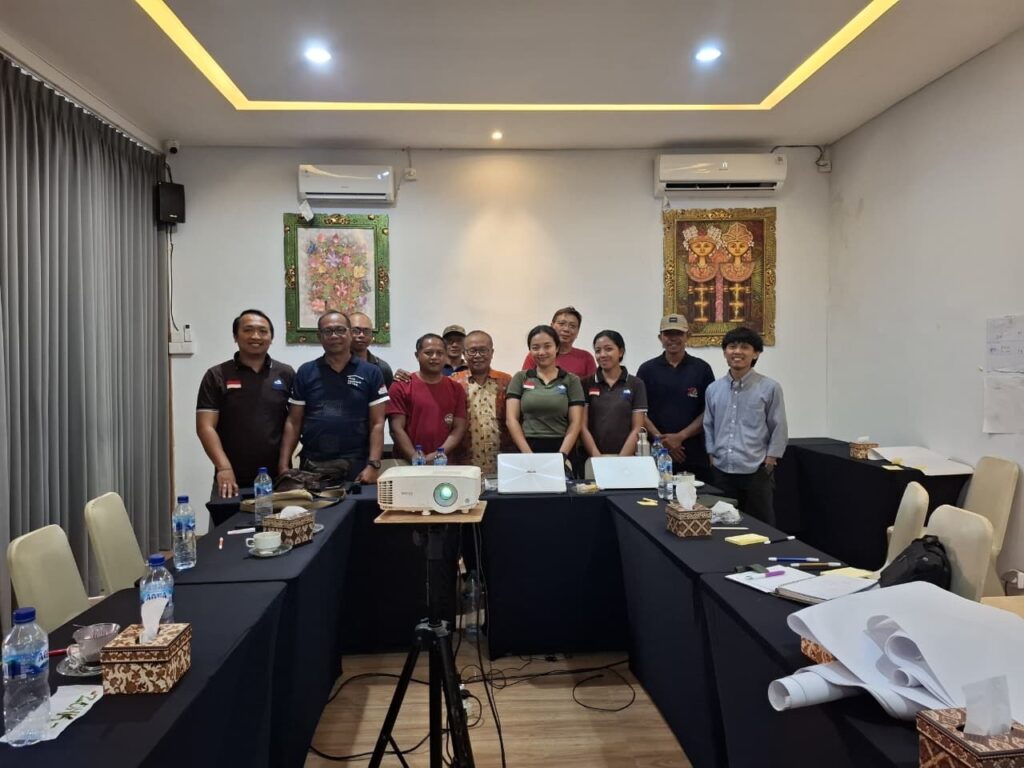
The recent financial workshop in Bali, for example, allowed representatives from MPT, Kopan Sikap and MAB to improve their practical use of accounting software and agree on follow-up actions. The sharing session complemented this work by creating space for partners to discuss how their businesses are performing, what support is working and where further improvements are needed.
Importantly, strong governance also means ensuring that farmers have a voice. Progreso emphasised the importance of understanding the community impact of its work and ensuring that farmers can participate in decisions about how their organisations use investments.
Looking ahead: Building resilience together
As the partners look towards 2027, their priorities reflect the interconnected nature of the challenges they face. Alongside financing, they identified needs related to financial and governance capacity, production and processing, farmer services and market access. For some, this means improving processing facilities or strengthening farmer training. For others, it means refining internal procedures, developing business plans or building connections with new buyers. The specific solutions will differ between organisations, depending on their context, business model and needs. What connects them is the importance of combining financial resources with the knowledge, systems and relationships needed to use them effectively. For Progreso, listening to partners is an important part of this process. By understanding their experiences and ambitions, the organisation can continue working with them to identify practical ways to strengthen their businesses and better serve the farmers they work with.
Building resilient coffee and cocoa businesses is not achieved through a single loan or training session. It is an ongoing process that brings together finance, organisational development, farmer participation and market opportunities, helping producer organisations navigate uncertainty and work towards a more sustainable future.
What does it take to build a stronger cooperative? For coffee and cocoa producers in Indonesia, it starts with a shared vision, clear priorities and a practical plan.
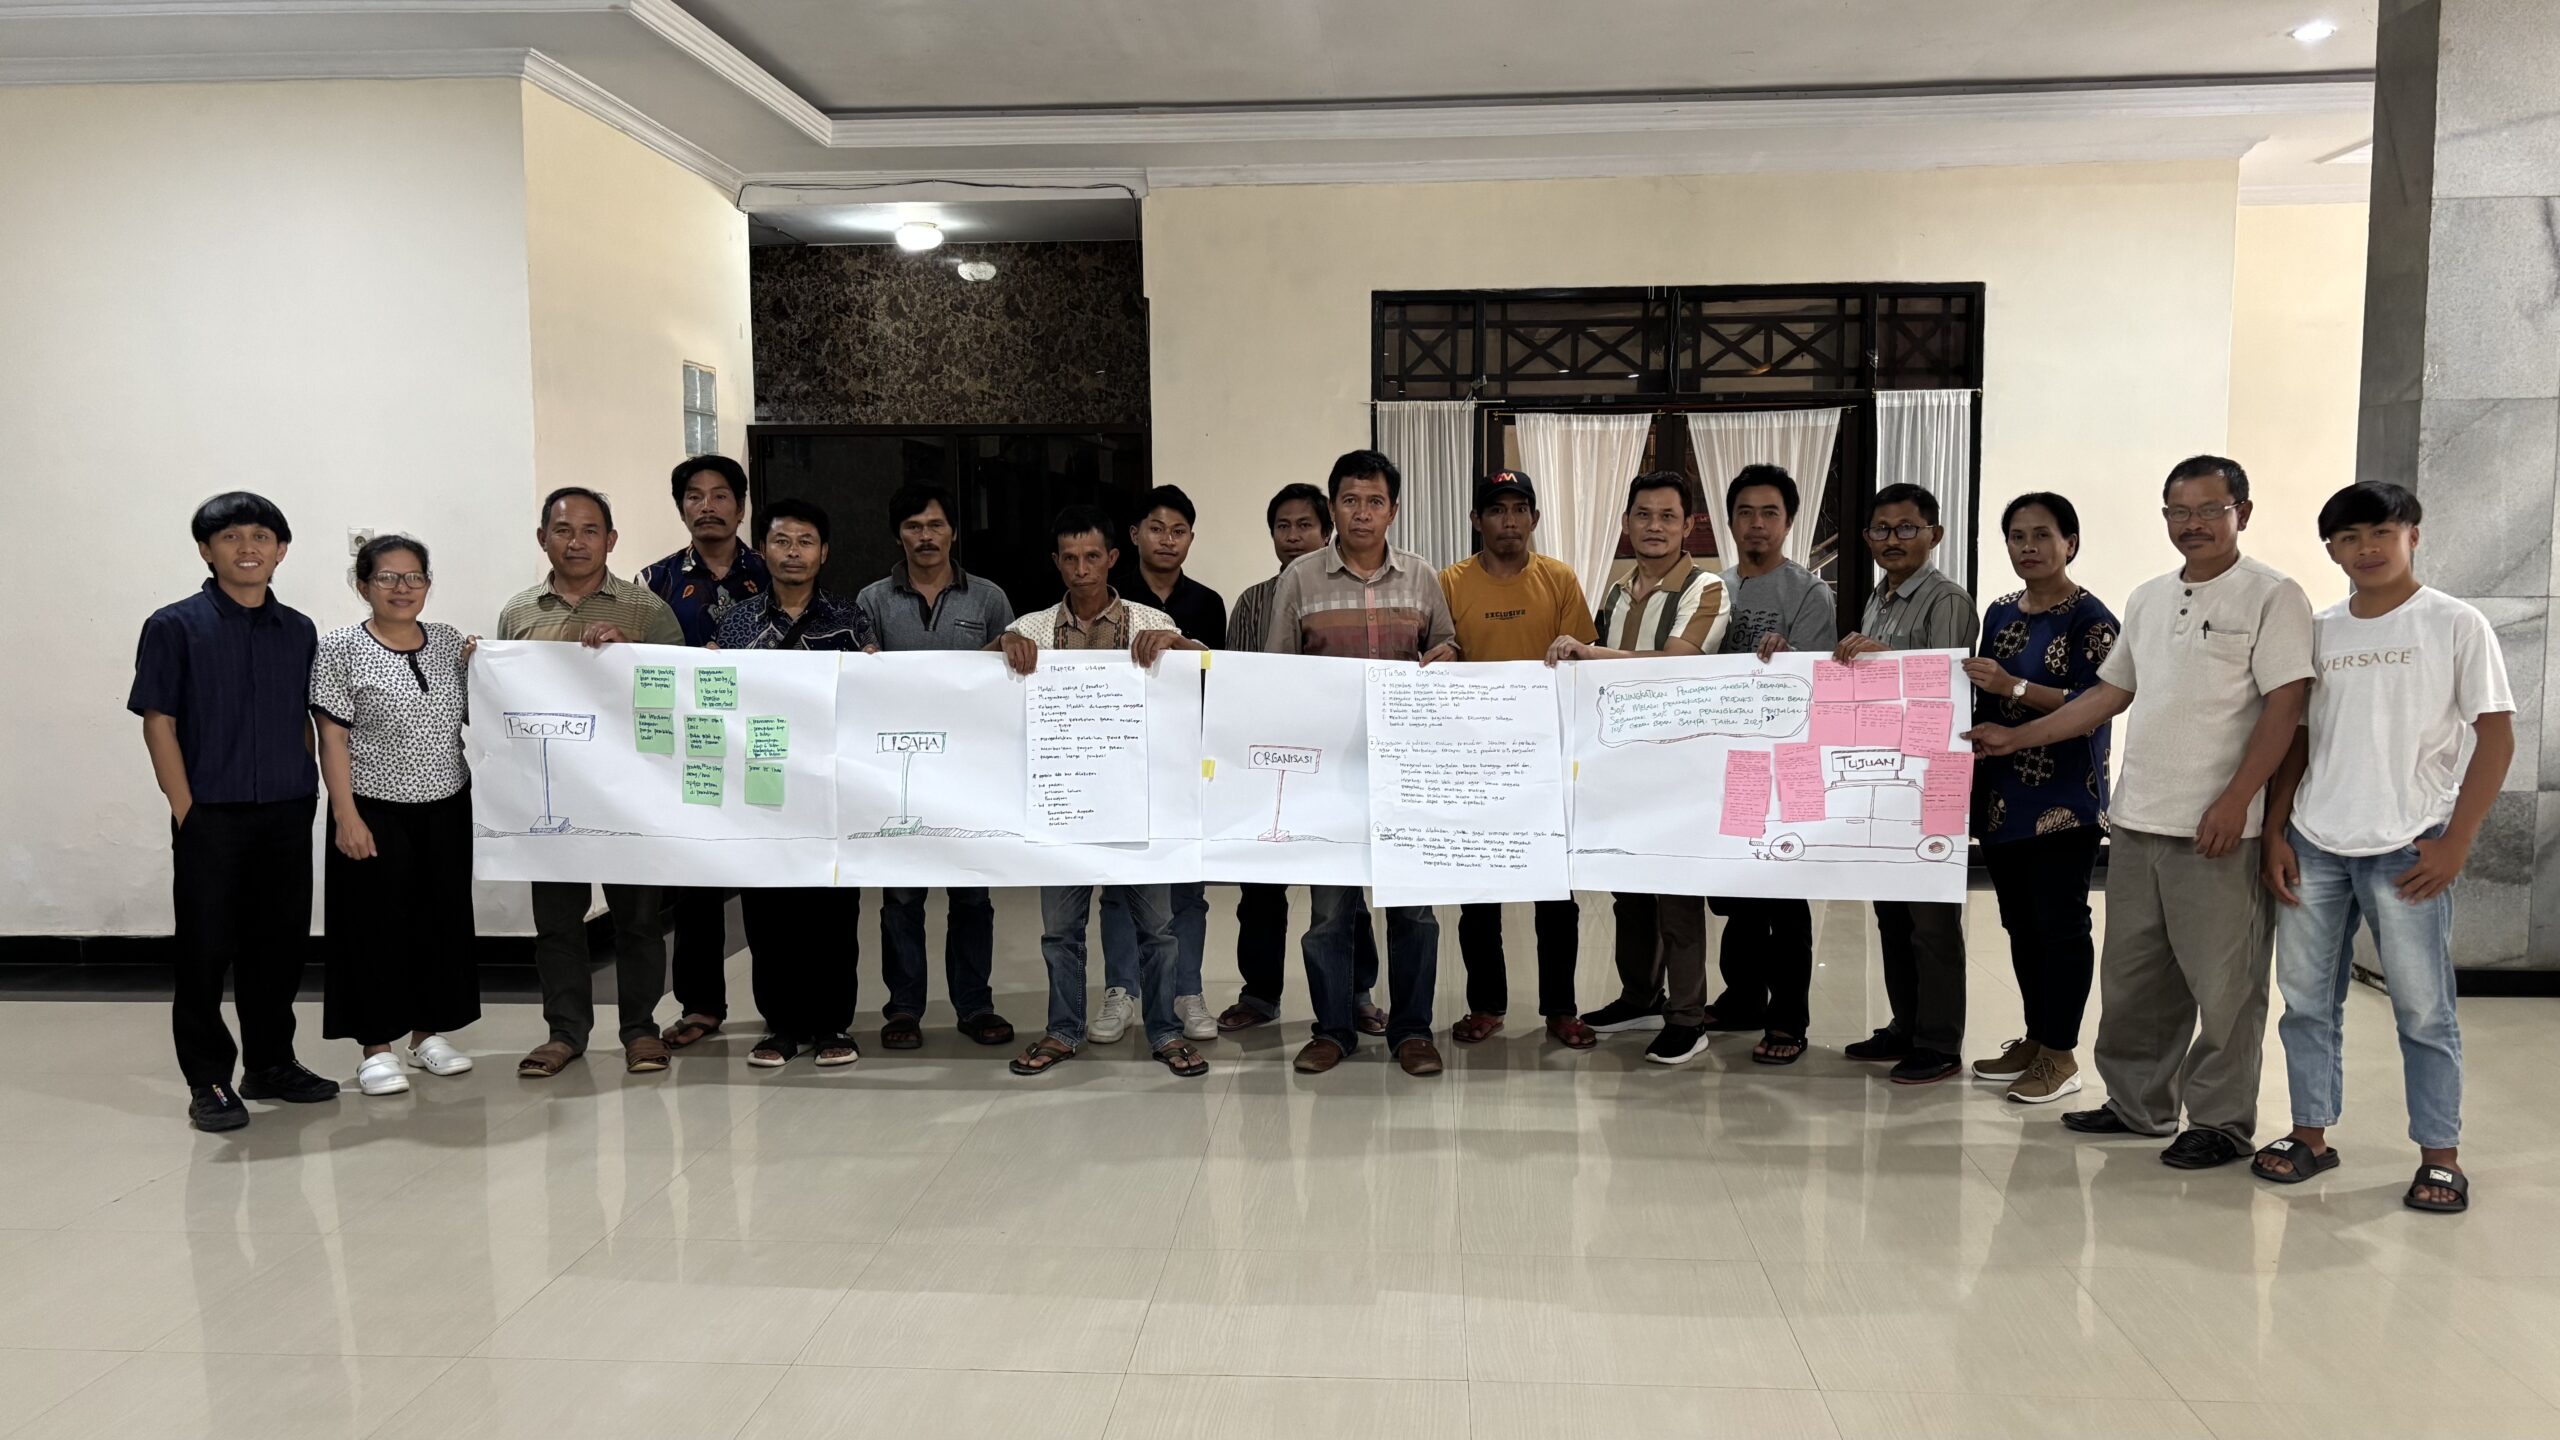
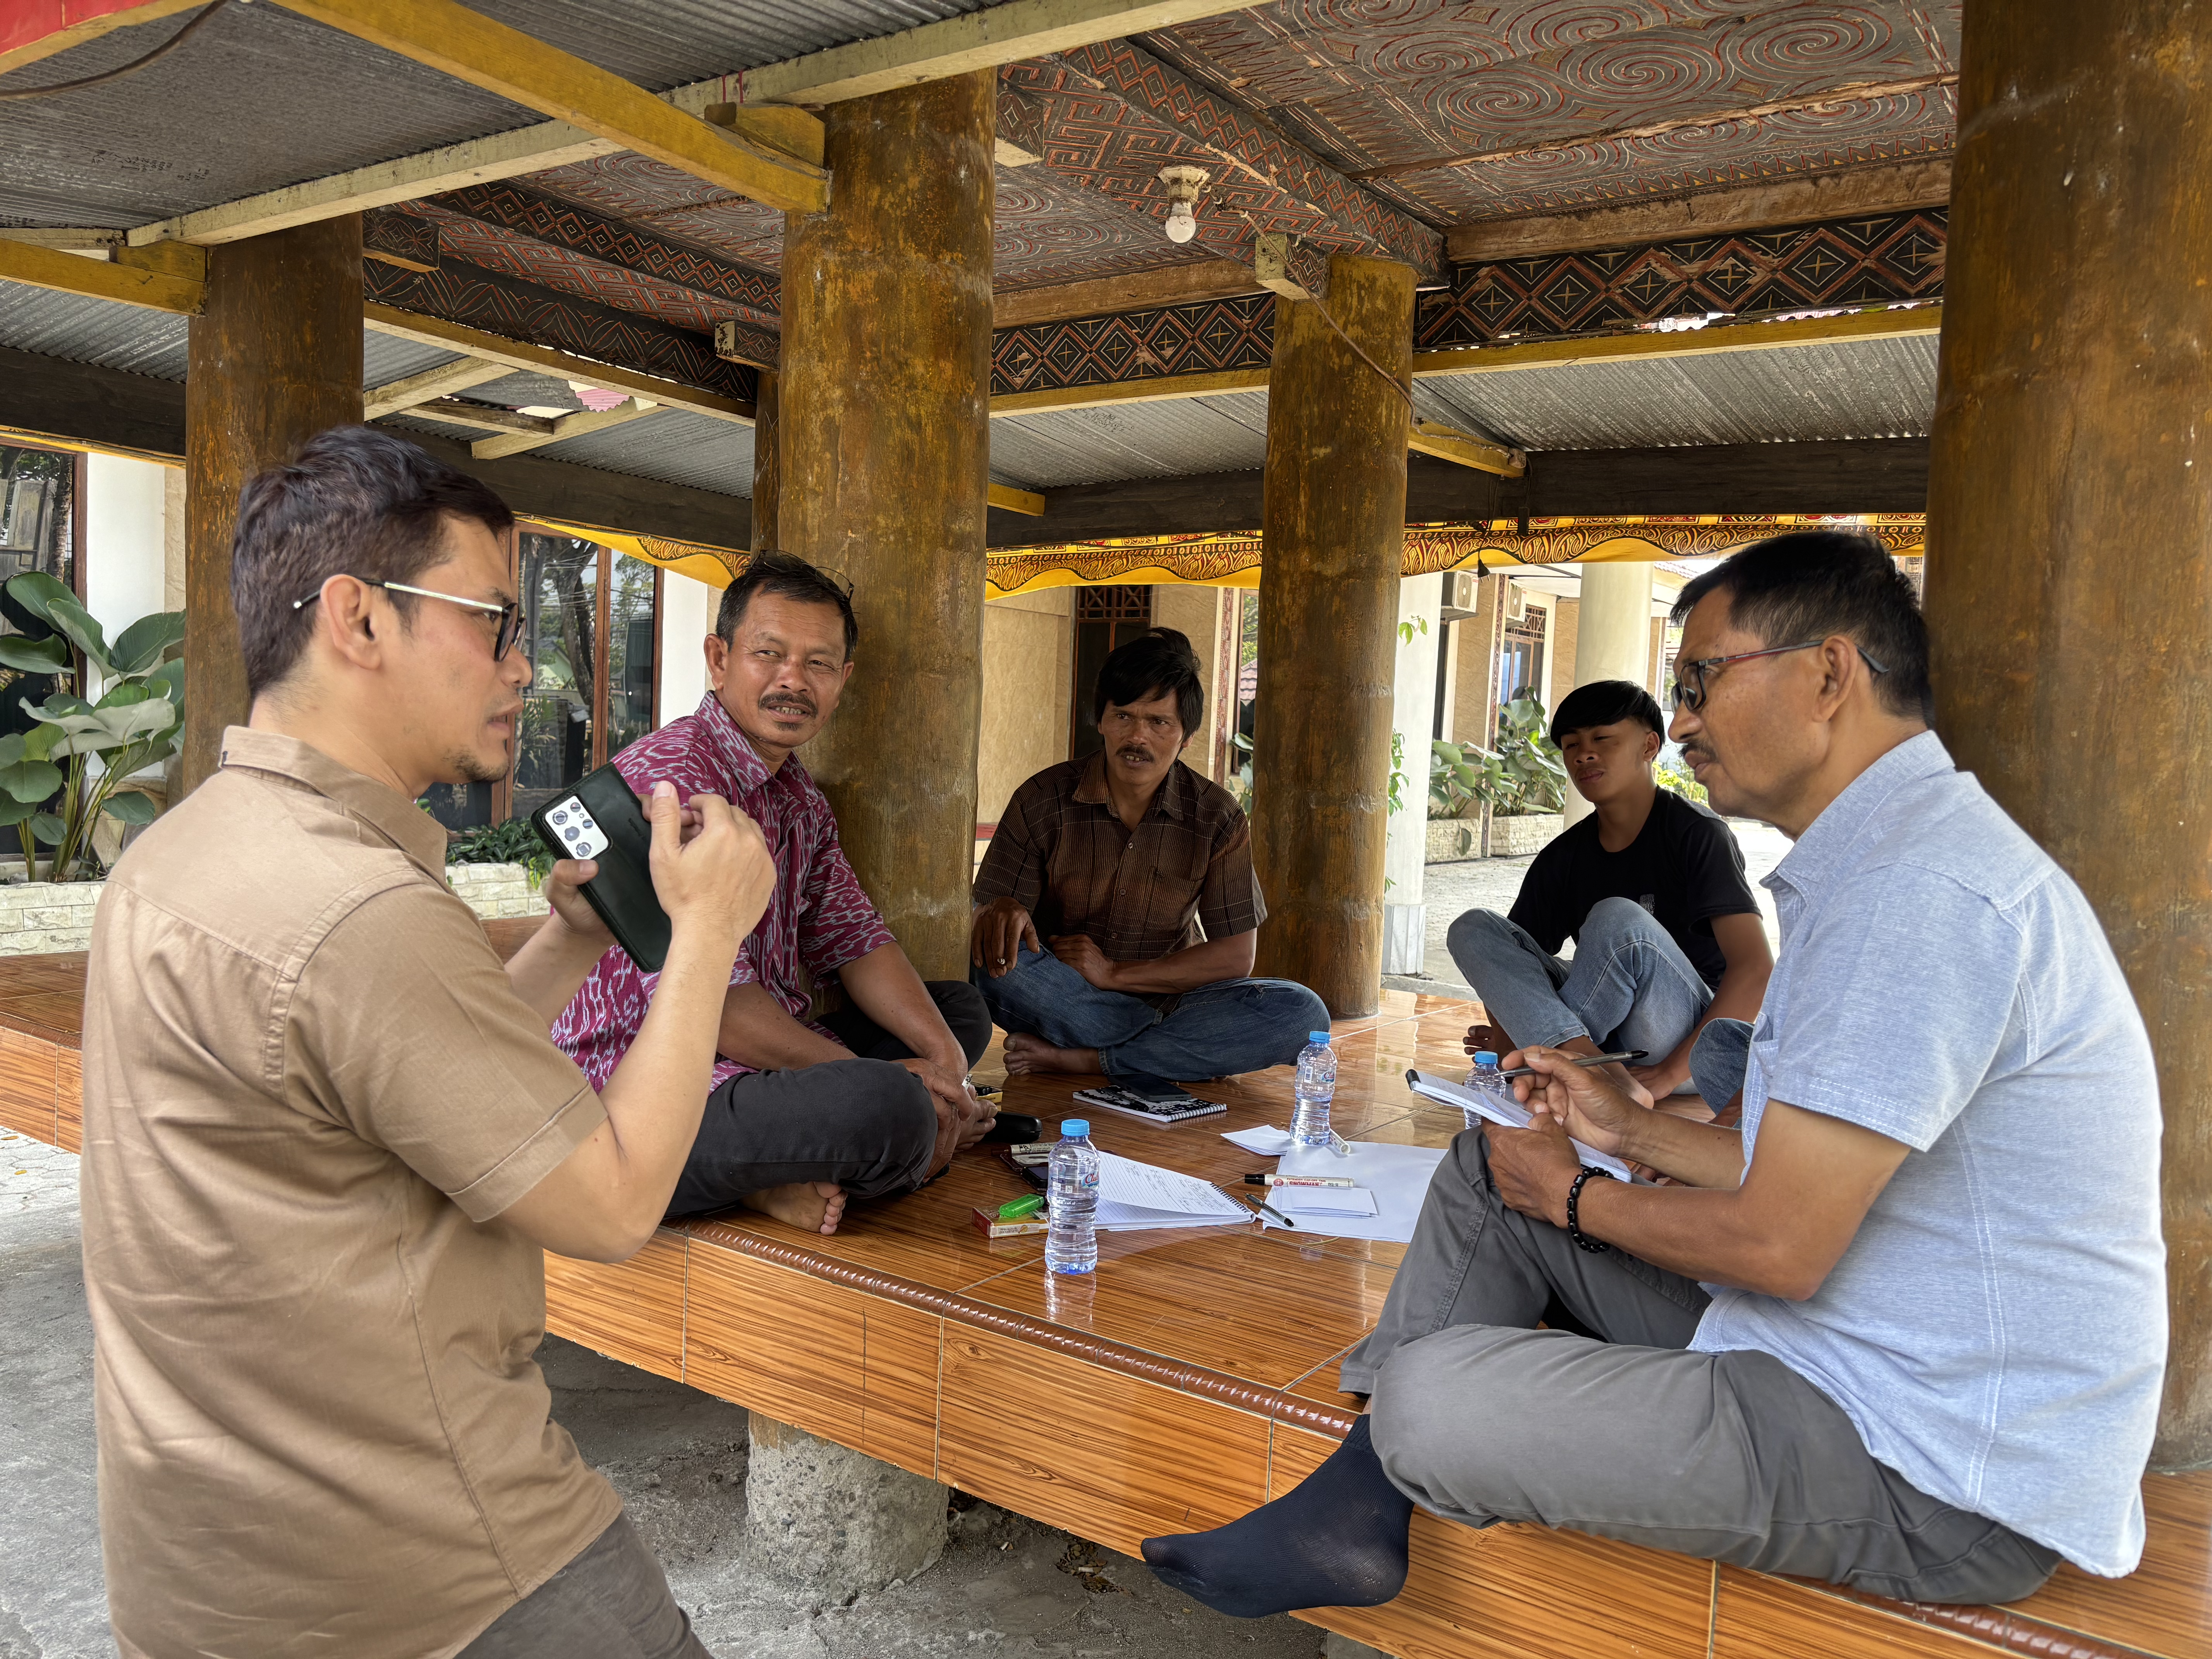
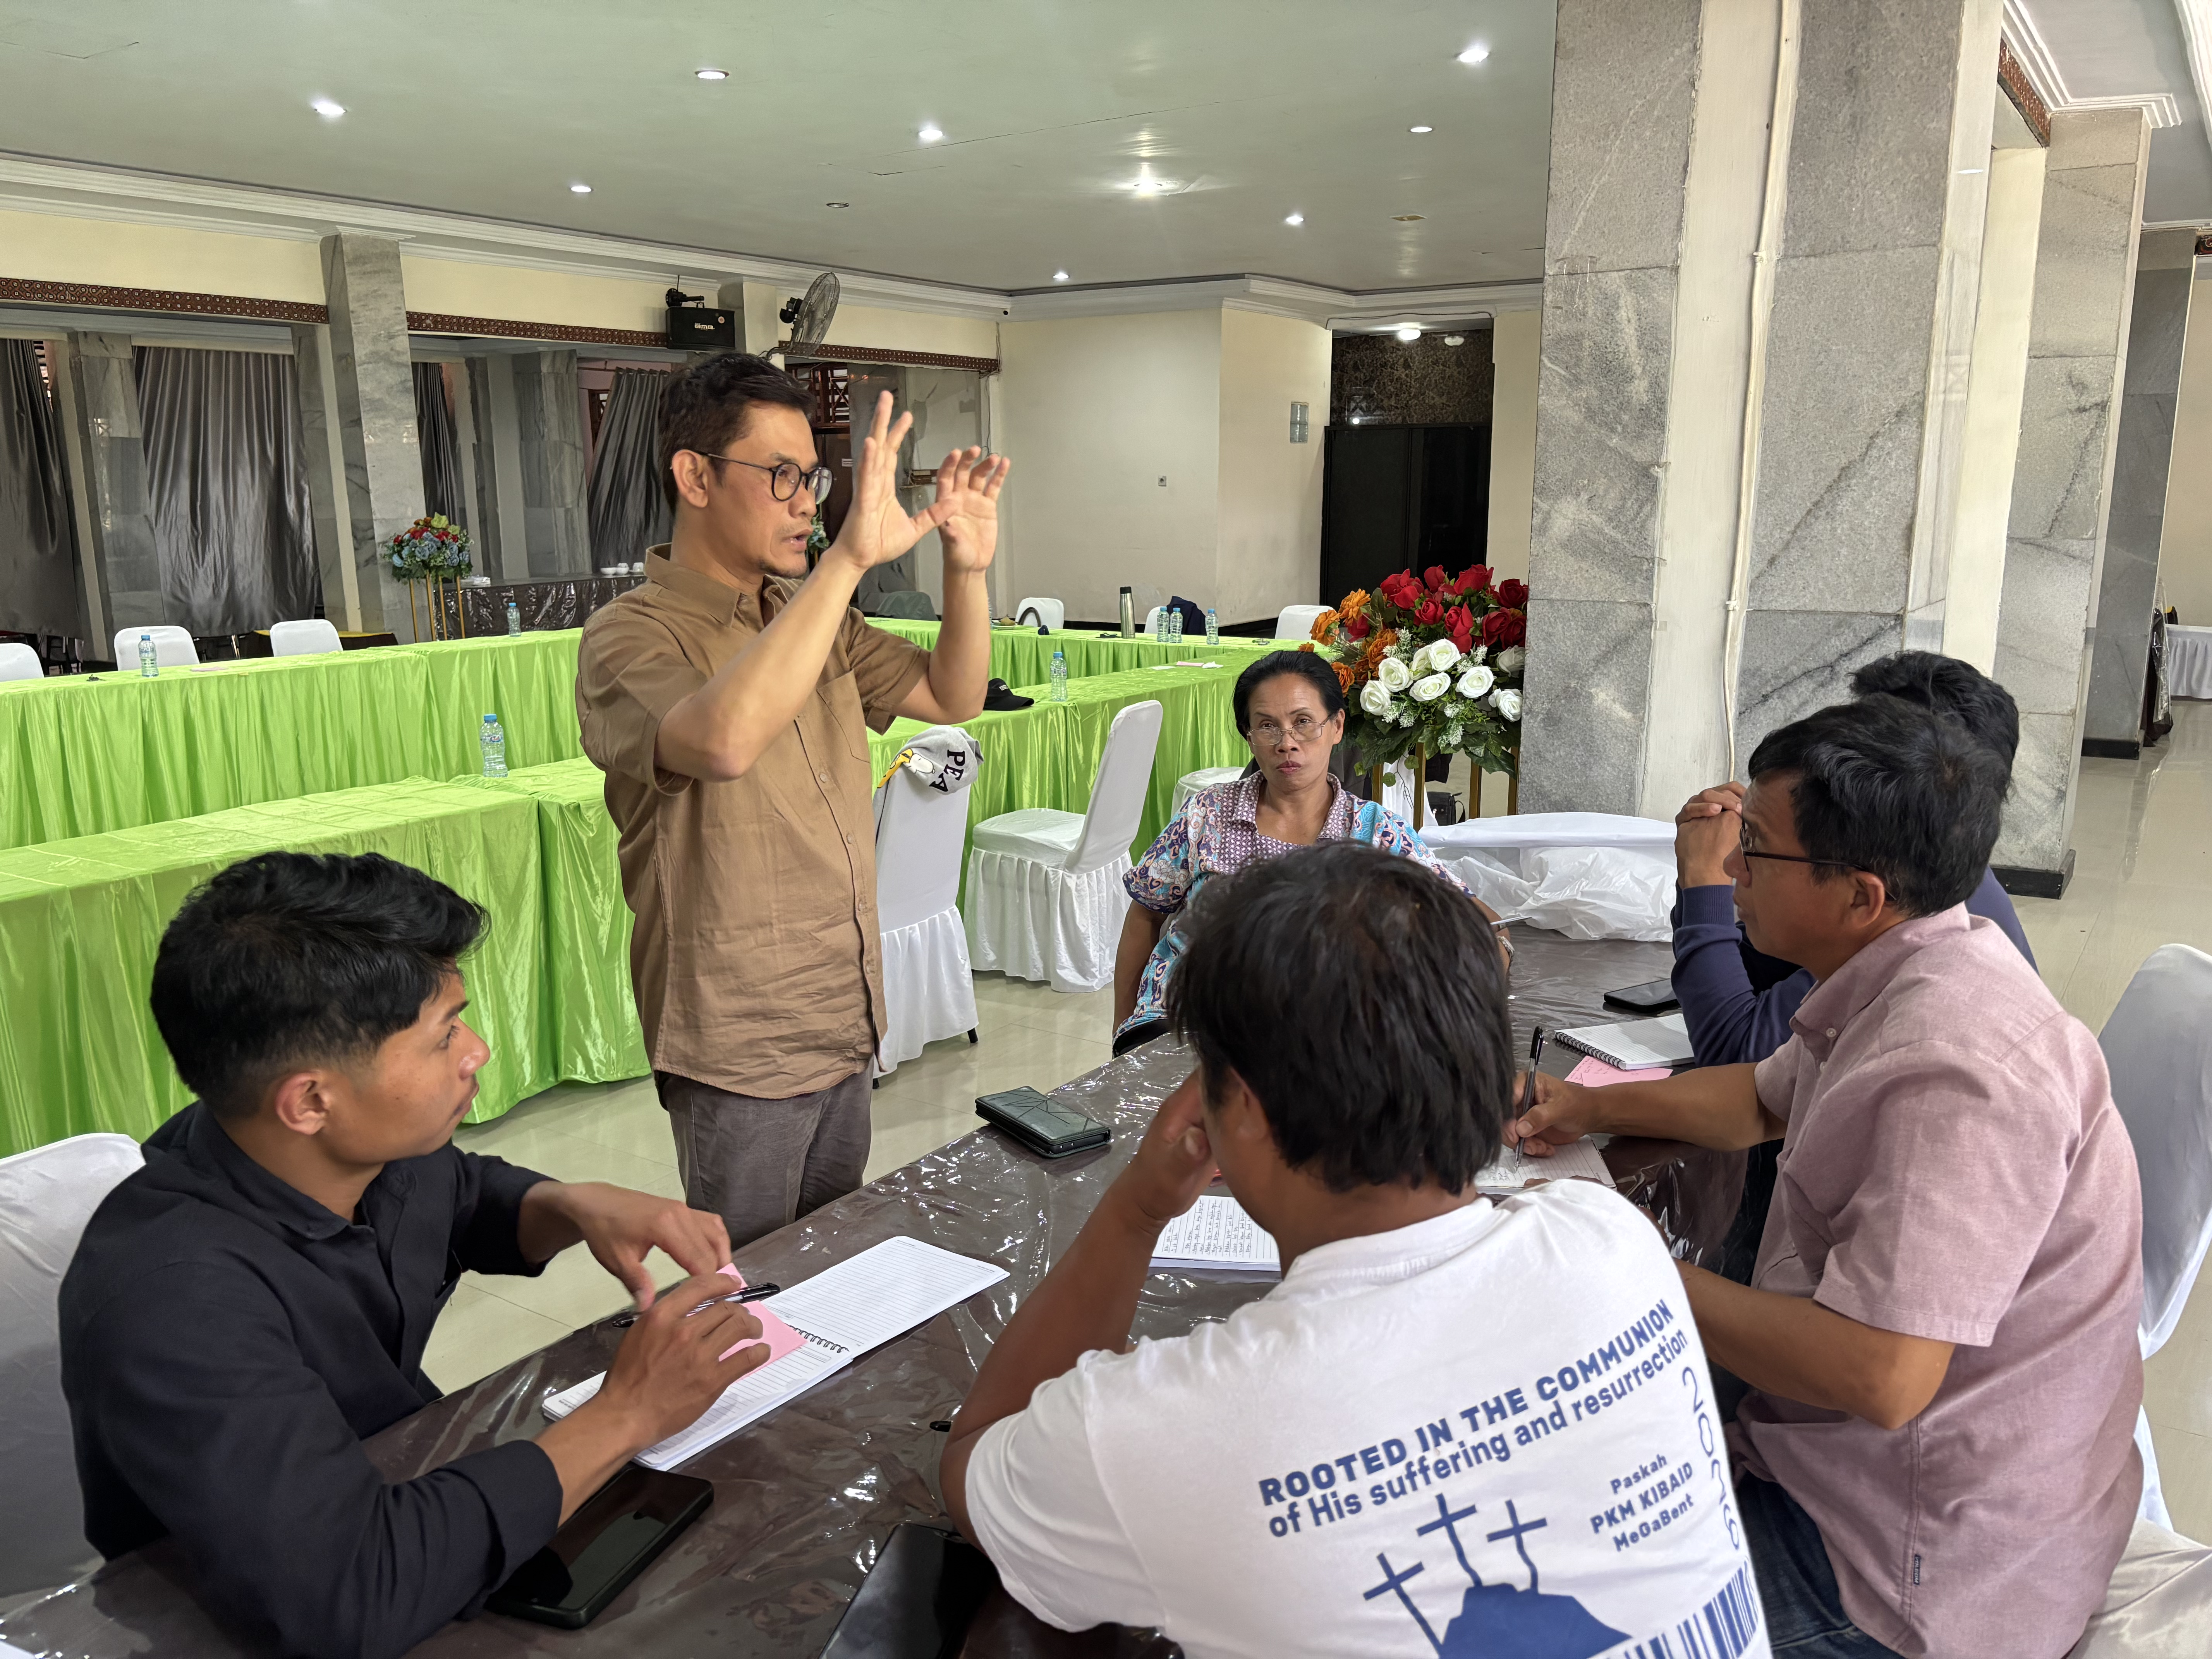
In late September and early October 2026, Progreso facilitated governance and business-planning workshops with two partner cooperatives: Mitra Petani Toraja (MPT) in South Sulawesi and Koperasi Manik Amerta Buana (MAB) in Bali. Bringing together board members, supervisors, managers and farmers, the workshops helped participants define their ambitions and identify priorities for the coming years.
Turning ambitions into concrete goals
Participants worked together to establish shared goals for their cooperatives. For MPT, the ambition is to increase active members’ income by 30% by 2029, supported by a 30% increase in green bean production and a 10% increase in green bean sales. Priorities in its draft business plan include strengthening cooperative governance and member services, establishing an input-supply unit and developing a coffee nursery. In Bali, MAB set a goal of improving members’ welfare through stronger collective cocoa marketing, with members increasing dried cocoa production by 20 tonnes by 2029. Its proposed priorities include strengthening relationships with regular buyers, improving production capacity and developing clearer internal procedures.
From planning to implementation
Both workshops addressed three areas: institutional development, business operations and production. Participants identified priority activities, discussed implementation responsibilities and began preparing budgets. MPT developed a draft business plan and a 2027 budget with activities, timelines and assigned responsibilities. MAB developed its draft business plan for 2027–2029 and began preparing its 2027 budget, with further coaching planned to complete the process.
Both business plans are still being finalized and will be submitted for approval at their respective Annual Members Meetings (RAT). Once approved, they will guide the cooperatives’ activities over the coming years. As MAB participant Made Sukarta reflected: “We now understand better how to prepare the cooperative’s business plan and budget so that our business is more directed going forward. We hope what we have drawn up can truly be carried out.”
Strengthening the foundations for growth
Putting business plans into practice also requires clear roles and effective internal procedures. Both cooperatives are currently finalizing institutional Standard Operating Procedures (SOPs) to strengthen their organizational and operational management.
Through participatory workshops and continued coaching, Progreso supports coffee and cocoa producer organizations in developing the management capacity needed to implement their plans and work towards improved member livelihoods.
In the hills surrounding Bwindi Impenetrable National Park in Uganda, coffee production offers farmers an opportunity to build livelihoods while living alongside one of the country’s most important protected forests.
Limited income opportunities have historically contributed to some community members relying on forest resources for their livelihoods. Today, coffee farming provides an alternative source of income, including for some former poachers who have turned to agriculture.
Bwindi Coffee Growers Cooperative Society brings together 859 farmers, including 205 young people, who grow Arabica and Robusta coffee in the area. For many farming households, coffee income helps cover everyday expenses such as school fees, healthcare and other household needs.
The cooperative operates in a landscape of particular conservation importance. Bwindi Impenetrable National Park is home to endangered mountain gorillas, and the livelihoods of surrounding communities are closely linked to the long-term sustainability of the area. By providing farmers with an opportunity to earn an income from their farms, coffee can contribute to reducing economic pressures on forest resources.
Supporting coffee farmers and protecting the forest
For the farmers of Bwindi Coffee Growers Cooperative Society, coffee is both an agricultural activity and a source of income for their families. Strengthening these livelihoods can help create economic opportunities for communities living alongside the forest, while contributing to wider efforts to protect the surrounding landscape.
The coffee featured in the Progreso auction comes from farmers building their livelihoods around coffee in the communities surrounding Bwindi Impenetrable National Park.
Please welcome Albertino Huancas Julca to the Progreso Foundation team as our new Agroforestry Expert for Peru.
Albertino is an agricultural technician with many years of experience working with farming families and organizations across strategic value chains, including coffee and cocoa. His work has taken him into the field with cooperatives, producer associations and NGOs, supporting agroforestry systems, local businesses and initiatives that strengthen rural livelihoods.
He joined Progreso because he shares our belief that agroforestry can help farming families increase their incomes while protecting forests and biodiversity. In his new role, Albertino will work closely with producer organizations in Peru to support the adoption of profitable and sustainable agroforestry systems and help them respond to new market requirements, including the EU Deforestation Regulation (EUDR). He will also bring his knowledge of the local context to help build stronger connections between Progreso’s global team and farming communities.
Beyond his work, Albertino is a passionate coffee lover. With training in coffee cupping, he particularly enjoys sharing a good cup with the people who produce it. He is also studying Industrial Engineering, driven by his belief that there is always something new to learn.
And when he is not working or studying? You’ll probably find him playing football or out hiking. His favourite food is chicharrón de chancho, and his four-legged companion is Doki.
On 2 December 2026, Beyco by Progreso Foundation and V Auction by Vollers will host an online auction featuring selected coffees from eight Ugandan cooperatives.
From the volcanic slopes of Mount Elgon to the foothills of the Rwenzori Mountains and the communities surrounding Bwindi Impenetrable National Park, these coffees come from very different landscapes and from cooperatives with equally diverse stories.
The participating cooperatives are Bushika Integrated Area Cooperative Enterprise (BIACE), Butta Farmers’ Cooperative Society, Mt. Elgon Agroforestry Communities Cooperative Enterprise (MEACCE), Nyamirima Mutegaya Cooperative Society, Rwenzori Organic Farmers Mountain Harvest Cooperative Society (ROCS), Bundikakemba, Kilhubo and Bwindi Coffee Growers Cooperative Society.
Behind each lot are farmers and cooperative teams working to improve both the coffee they produce and the businesses that connect them to the market.
At Bushika, farmers on the slopes of Mount Elgon are combining coffee production with agroforestry and income diversification. More than two million trees have been planted, alongside activities such as beekeeping and banana wine production.
At Butta, farmers are taking a regenerative approach to coffee production. Through the cooperative’s Wonder Farms initiative, they are improving soil health, producing natural fertilisers and planting improved coffee varieties, while the cooperative’s SACCO provides access to finance for farm investments.
At MEACCE, the focus extends beyond the coffee itself. The cooperative is investing in the people who sort and prepare the coffee, many of them women, with measures such as protective equipment, improved working conditions and childcare facilities.
In Ibanda, Nyamirima Mutegaya is a young cooperative building its export business while creating opportunities for women and young people to take on leadership and management roles.
Meanwhile, ROCS is developing its position in the Rwenzori coffee sector. With more than 1,000 members, the young cooperative is expanding its processing capacity and looking to strengthen direct connections with specialty coffee markets.
And around Bwindi, coffee is part of a wider story about livelihoods and conservation. For farmers living alongside one of Uganda’s most important forests, coffee can provide an alternative source of income and reduce economic pressure on the forest.
These are just some of the stories behind the coffees going under the hammer. Through its work with these cooperatives, Progreso supports improvements in agronomy, post-harvest handling, quality control, traceability and market access. The auction is a next step: an opportunity to bring these coffees to international buyers, give cooperatives greater visibility and create new commercial relationships that can develop beyond a single transaction.
In the coming weeks, we’ll introduce the participating cooperatives and the people behind the coffees, and share more about the lots, samples and how to participate.